
Total liquid fuels inventories return to five-year averages in the United States and OECD
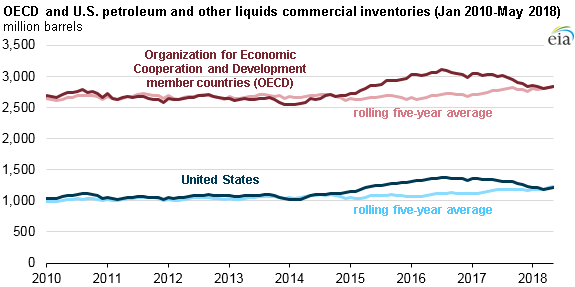
Global petroleum inventories declined through 2017 and the first quarter of 2018, marking the end of an extended period of oversupply in global petroleum markets that began before the Organization of the Petroleum Exporting Countries (OPEC) November 2016 agreement to cut production. OPEC plans to reconvene on June 22, and markets now appear more in balance, but uncertainty remains going forward.
As a result of the November 2016 OPEC supply agreement, which took effect in January 2017, OPEC member countries agreed to reduce crude oil production by 1.2 million barrels per day (b/d) compared with October 2016 levels and to limit total OPEC production to 32.5 million b/d. In addition, Russia agreed to reduce its crude oil production. OPEC extended the agreement in November 2017, with the production cuts remaining in place until the end of 2018.
Since the agreement took effect, global oil markets have tightened, which can be seen in the decline in crude oil and other liquids inventories following sustained increases in quarterly global liquid inventories from mid-2014 through most of 2016.
Data on global petroleum inventory levels are not collected directly, but changes in global inventories are implied based on the difference between estimates of world production and world consumption. For the United States and for countries in the Organization for Economic Cooperation and Development (OECD), however, inventory estimates are available and can indicate what is happening globally.
From January 2017 to April 2018, OECD inventories decreased by 234 million barrels. The United States accounted for more than half of that decline, as U.S. crude oil and other liquids inventories decreased by 162 million barrels over that period. By the end of April 2018, both OECD and U.S. inventory levels were lower than the averages for April 2013–April 2017.
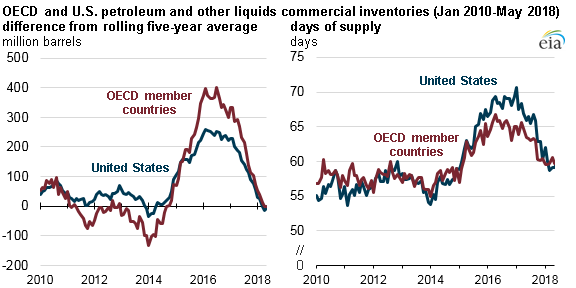
The days of supply measure (the current inventory level divided by the next month’s estimated consumption) provides additional insight into market balances. Between January 2017 and April 2018, U.S. and OECD crude oil days of supply fell by 11.5 and 4.5 days, respectively, to 59.2 and 60.6 days. Even as this supply measure has declined, current levels are still slightly higher than levels held for several years before 2015.
EIA forecasts that the tightening trend in global petroleum markets will soon reverse. In the May 2018 Short-Term Energy Outlook, EIA forecasts that both U.S. and OECD petroleum and other liquids inventories will return to surpluses compared with their five-year averages, although on a smaller scale compared with 2015–2016.
U.S. and OECD days of supply are forecast to remain close to their previous five-year average levels through 2019. However, additional uncertainty about future global oil market balances remains in light of, among other factors, the U.S. withdrawal from the Joint Comprehensive Plan of Action (JCPOA) and continued political instability in Venezuela.
Principal contributor: Mason Hamilton
Tags: OPEC, liquid fuels, oil/petroleum, inventories/stocks, OECD