
Summer gasoline prices expected to be highest in four years
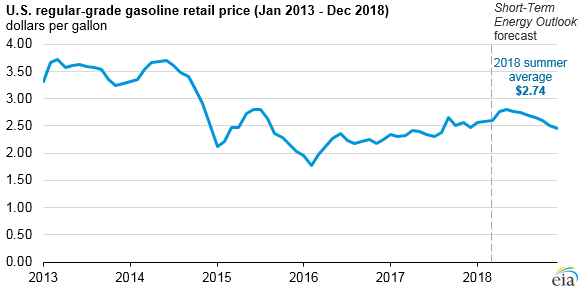
EIA forecasts that drivers in the United States will pay an average of $2.74 per gallon (gal) this summer for regular gasoline, the highest average summer gasoline price in four years, according to EIA’s Short-Term Energy and Summer Fuels Outlook. EIA’s forecast gasoline price for summer 2018 (April through September) is 26 cents/gal higher than the average price last summer, largely reflecting changes in crude oil prices. Overall gasoline expenditures in 2018 are expected to be about $2,300, or nearly $200 more per household than in 2017.
EIA projects that monthly average gasoline prices will reach a peak of $2.79/gal in May before falling to $2.65/gal in September. Gasoline prices are often higher in summer months when gasoline demand is higher. In these months, federal and state environmental regulations require the use of summer-grade gasoline, which is more expensive to manufacture. For all of 2018, EIA forecasts U.S. regular gasoline prices to average $2.64/gal.
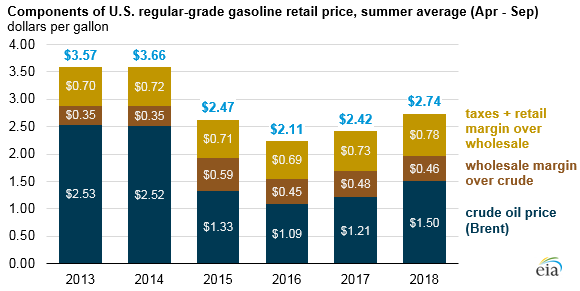
Gasoline prices are made up of four main components: crude oil prices, wholesale margins, retail distribution costs, and taxes. The latter two are generally stable, so changes in gasoline prices are primarily attributable to changes in crude oil prices and wholesale margins.
Gasoline prices in the United States have tended to reflect changes in the Brent global crude oil benchmark. Because a barrel of oil contains 42 gallons, each dollar per barrel (b) of sustained price change in crude oil and gasoline wholesale margins translates to an average 2.4-cent-per-gallon change in petroleum product prices.
EIA forecasts that Brent crude oil will average $63/b ($1.50/gal) this summer, about $12/b ($0.29/gal) higher than last summer. Crude oil prices have increased this year, in part, because of extensions to the coordinated crude oil production reductions by the Organization of the Petroleum Exporting Countries.
This summer, EIA expects wholesale gasoline margins (the difference between the wholesale price of gasoline and Brent crude oil price) to average 46 cents/gal, about 2 cents/gal lower than last summer. Despite lower margins, EIA projects that continued growth in gasoline exports and higher domestic consumption will lead to higher gasoline yields this summer, with gasoline production averaging about 170,000 barrels per day (b/d) more than last summer.
EIA expects U.S. motor gasoline consumption for summer 2018 to average 9.6 million b/d, up slightly (0.2%) from last summer. Summer highway travel is projected to increase by 1.3%, but its effect on motor gasoline use will be partially offset by a 1.2% increase in fleet-wide fuel efficiency.
Regional differences in retail gasoline prices can be significant, and EIA forecasts average summer prices to range from a low of $2.45/gal in the Gulf Coast region to $3.22/gal in the West Coast region, as defined by Petroleum Administration for Defense Districts.
Gasoline prices in the West Coast region are often the highest in the country because California requires a blend of gasoline that is relatively costly to produce, and some states in the region have higher state tax rates compared to the national average. Gulf Coast gasoline prices are often among the lowest in the country because the region generally has low state tax rates and abundant gasoline supplies, as it is home to about half of all U.S. petroleum refining capacity.
Principal contributor: Sean Hill