
Positive U.S. ethanol margins are driving ethanol production growth
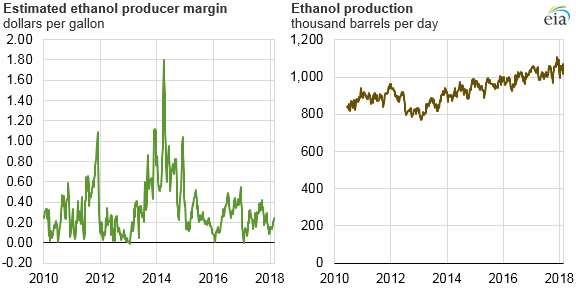
Estimated ethanol production margins at U.S. corn ethanol plants averaged 22 cents per gallon (gal) in 2017. Last year was the fifth consecutive year that margins have averaged more than 20 cents/gal, which has helped drive consistent ethanol production growth over that period. U.S. ethanol production averaged an estimated 1,032 thousand barrels per day (b/d) in 2017, marking a fifth consecutive record level of annual production.
Increases in ethanol supply have outpaced increases in domestic demand in 2017, which have contributed to relatively low spot prices and margins that are about 20 cents/gal lower than the previous four-year average but still largely in line with levels in the previous two years.
Ethanol producer margins are estimated by EIA for a dry mill corn ethanol plant of average capacity located in the Midwest, a region that is home to more than 90% of domestic fuel ethanol production capacity. EIA estimates these margins by taking the sum of revenue generated from the sale of ethanol and co-products, such as distillers’ dried grains with solubles (DDGS) and corn oil, and subtracting variable and fixed costs. Variable costs include expenses such as the cost of corn and natural gas, along with a fixed operating cost of 35 cents/gal.
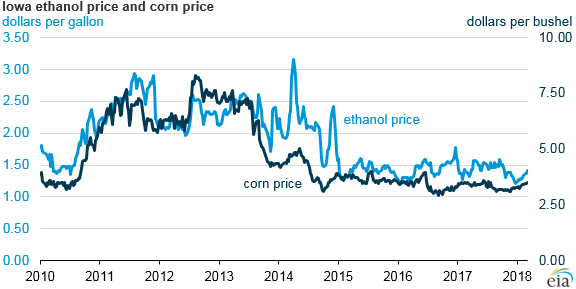
The price of corn is the largest variable cost associated with a dry mill corn ethanol plant, and profits are generally highest when corn supply is plentiful and demand for ethanol gasoline blending is high. U.S. corn production has been at record high levels in recent years, which has kept corn prices generally stable, ranging between $3.40 and $4.00 per bushel since 2015. A period of drought in 2012 and 2013 led to corn prices greater than $8.00 per bushel, resulting in one of the least profitable periods for ethanol operators.
In the United States, ethanol is primarily used as a blending component in the production of motor gasoline and mainly blended in volumes up to 10% ethanol, known as E10. Ethanol demand is highly dependent on motor gasoline consumption, and ethanol production has been driven higher in recent years because of the Renewable Fuel Standard (RFS), the program administered by the U.S. Environmental Protection Agency that mandates the blending of biofuels into the nation’s fuel supply. Although demand for higher ethanol blends such as E15 and E85 remains limited, low ethanol prices and increasing RFS targets have created favorable blending conditions for these higher ethanol blends.
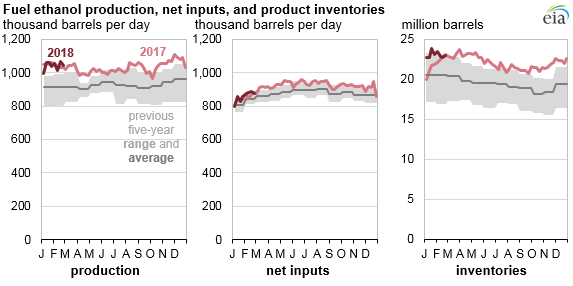
For most of 2017 and the first two months of 2018, ethanol production, net inputs, and inventory levels have been near or above average levels in the previous five years (2012–2016). During December 2017, fuel ethanol production set a four-week record high, averaging 1.09 million b/d, while ethanol blending into gasoline, measured by net inputs, was nearly unchanged from the previous year. Despite record-high domestic gasoline demand and record-high ethanol exports in 2017, ethanol production exceeded consumption, which led to end-of-2017 inventories that were four million barrels higher than at the end of 2016.
In its latest Short-Term Energy Outlook, EIA forecasts that continued growth in ethanol production and limited export growth through 2019 will lead to increases in domestic consumption of ethanol by way of limited higher-level ethanol blend growth beyond E10. U.S. ethanol consumption, which increased by 1% in 2017, is expected to increase by an average of 1% through 2019, resulting in an estimated ethanol blend percentage of gasoline that increases from slightly more than 10.1% in 2017 to about 10.3% by 2019.
Principal contributors: Steve Hanson, Sean Hill