
Natural gas production in Bakken region increases at a faster rate than oil production
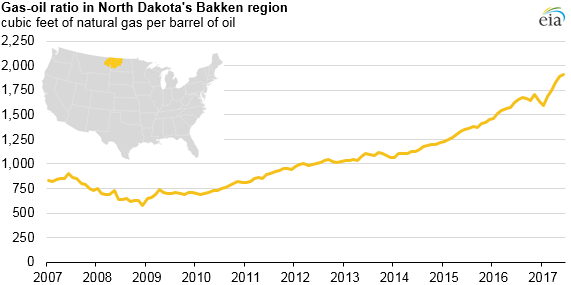
In North Dakota’s Bakken region, the ratio of natural gas production relative to crude oil, known as the gas-oil ratio, has been gradually increasing since 2008 and has increased at a faster rate since 2014. More than 90% of North Dakota’s crude oil and natural gas production comes from the Bakken region, which includes the Bakken and Three Forks formations.
Total North Dakota crude oil production peaked at more than 1.2 million barrels per day (b/d) in December 2014, but production has since dropped to 1.07 million b/d (as of August 2017), based on data in EIA’s Monthly Crude Oil and Natural Gas Production Report. The record crude oil production in late 2014 was the result of increasing crude oil production from the Bakken and Three Forks formations. Despite production declines in 2016, North Dakota remained the second-largest oil-producing state, accounting for 11% of total U.S. crude oil production.
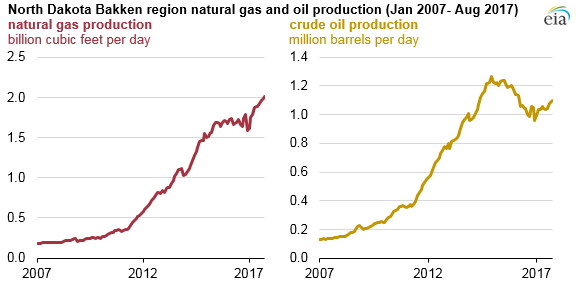
While oil production has slowed in North Dakota, natural gas production has continued to grow, reaching a record high of 1.94 billion cubic feet per day (Bcf/d) in August 2017, or the energy equivalent of about 334,000 b/d of crude oil. Despite the increasing gas-oil ratio, North Dakota still produces more than three times as much energy from crude oil as from natural gas.
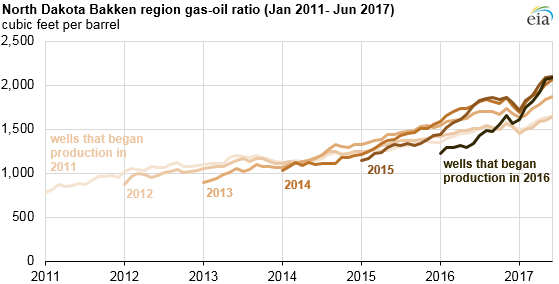
In tight oil formations like the Bakken and Three Forks—which have low permeability—the gas-oil ratio tends to increase only gradually over an extended period of time before reaching a certain point at which it then increases significantly. As producers extract hydrocarbons from a rock formation, the pressure in the formation eventually falls below the point at which natural gas naturally separates from the gas-saturated crude oil—a threshold known as the bubble point. More oil relative to natural gas tends to be produced during the initial phases of production, after which natural gas production can increase once pressure in the formation reaches the bubble point.
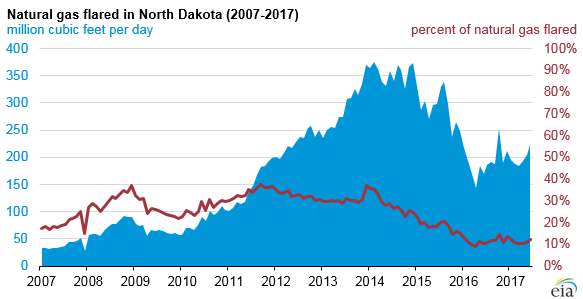
In previous years, insufficient infrastructure to collect, gather, and transport North Dakota’s increasing natural gas production meant more than 35% of the state's gross withdrawals of natural gas was flared rather than marketed. In an effort to reduce the amount of flared gas, North Dakota's Industrial Commission established new targets in 2014 to limit flaring to 10% by October 1, 2020. Based on data from North Dakota's Industrial Commission, the volume of flared natural gas has declined from more than 0.35 Bcf/d in 2014 to about 0.20 Bcf/d in 2017—about a 40% decline.
Principal contributors: April Volke, Emily Geary, Neal Davis