
Mexico publishes first monthly natural gas price index after moving to competitive market
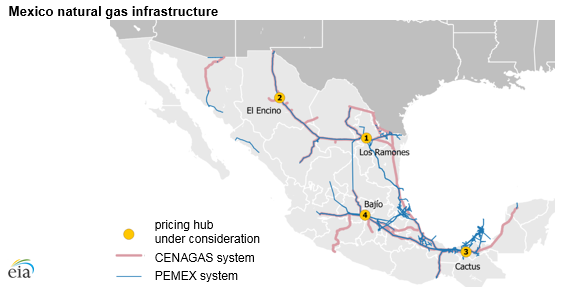
Mexico’s Energy Regulatory Commission (CRE) released its first monthly price report on August 18, 2017. As part of its ongoing series of energy reforms that reduce government market controls, the Mexican government converted to a liberalized natural gas market on July 1, 2017. Several government agencies are working to make market data more transparent by implementing electronic reporting systems. In addition to the CRE price index report, Mexico’s pipeline system operator (CENAGAS) launched its natural gas capacity reservation system with electronic bulletin boards for posting natural gas flows.
The first CRE report showed that Mexican marketers sold natural gas at an average price of U.S. $4.10 per million British thermal units (MMBtu) in July 2017. The Índice de Referencia Nacional de Precios de Gas Natural al Mayoreo (IPGN) includes the national average of all transactions reported by merchants.
The price index system captures data on day-ahead spot sales in the natural gas market. For each transaction, CRE requires that marketers report the volume, price per gigajoule (GJ), storage and transportation costs, and several other variables. For now, CRE will compile the information submitted for each day and publish non-proprietary information in a monthly public report on its website within 15 business days after the end of each month. Price reports and greater transparency will be instrumental in establishing regional price indices at market hubs.
Mexico’s national energy ministry (SENER) has identified four potential pricing hubs located at the convergence of natural gas pipelines where most trading is likely to occur: Los Ramones (near the industry-intense city of Monterrey), Encino (in the northern state of Chihuahua), Bajío (near Mexico City), and Cactus (in the southern state of Chiapas).
Market hubs provide a means for balancing supply and demand through the transparent reporting of market prices. The CRE took its initial step toward creating a competitive market and more price transparency on June 16, 2017, when it removed the price cap that PEMEX could charge for natural gas. This price cap is based on a combination of the U.S. Henry Hub natural gas futures prices, published distribution plant prices at Reynosa (near the U.S. border and the Gulf of Mexico), and transportation costs.
Eliminating the price cap allows economic agents other than PEMEX to offer supply options and for natural gas to be sold in Mexico on a competitive-market basis. This shift has also led to increasing Mexican production of natural gas. Since the elimination of the price cap, Mexico has held three rounds of upstream auctions for oil and natural gas exploration in June and July 2017, selling 79% of available auction blocks. Mexico plans to hold two more auctions in early 2018.
According to Natural Gas Intelligence, the last capped prices published in June were $2.95/MMBtu at Reynosa and $3.21/MMBtu at Ciudad PEMEX. These prices were $1.15/MMBtu and $0.89/MMBtu lower, respectively, than the average July competitive-market price. However, in its press release, CRE noted that the IPGN is neither a regulated price nor a mandatory reference. In the long term, CRE may stop publishing the natural gas price indices once enough market information—such as independently developed price indices at market hubs—is available for participants to make informed decisions.
Principal contributor: Kristen Tsai
Tags: map, Mexico, natural gas, prices