
American households use a variety of lightbulbs as CFL and LED adoption increases
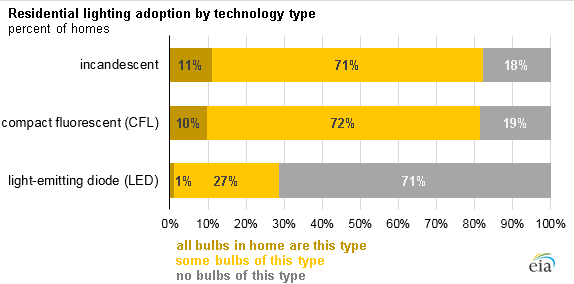
As lighting technologies evolve and adapt to federal standards, lighting in U.S. homes is in a state of transition. Data from the 2015 Residential Energy Consumption Survey (RECS) show that, as of 2015, most homes in the United States used more than one type of light bulb, primarily a mix of incandescent and compact fluorescent (CFL). Adoption of light-emitting diode (LED) bulbs has been increasing, with 29% of U.S. households reporting at least one LED bulb installed.
Residential lighting generally shifted from less energy-efficient lighting, primarily incandescent bulbs, to more energy-efficient lighting, including CFLs and LEDs. In 2009, 58% of all households used at least one energy-efficient bulb indoors. In the 2015 RECS, which was administered from August 2015 to April 2016, 86% of households reported using at least one CFL or LED bulb. Nationwide, 18% of households reported that they had no incandescent bulbs in their homes.
Increasing the use of energy-efficient lighting has been a focus of many programs conducted by state and local governments and electric utilities. Between the two most recent iterations of the RECS (2009 and 2015) the lighting standards specified in the Energy Independence and Security Act (EISA) of 2007 began to influence residential lighting. EISA increased the minimum efficiency standards for general service bulbs (the type most commonly found in homes) starting in 2012, requiring that new bulbs be about 25% more efficient than traditional incandescent bulbs.
Efforts such as the federal ENERGY STAR program and the Lighting Facts labeling program were intended to help consumers make informed lighting choices. Energy efficiency programs administered by utilities and agencies in many states offered free or subsidized high-efficiency bulbs and provided education about energy efficiency.
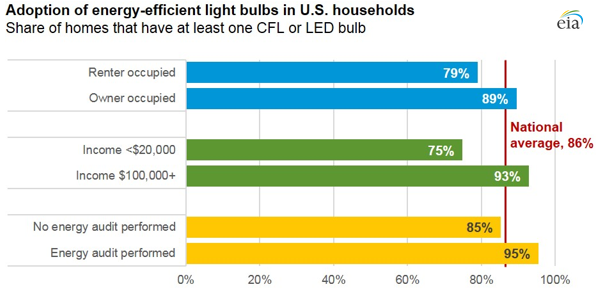
According to the 2015 RECS, while most U.S. housing units have been using at least some energy-efficient bulbs, certain characteristics are associated with a higher rate of adoption:
- Renters may not be responsible for their own lighting choices or may not pay their electricity bills directly, so they may not be as invested in improving the energy efficiency of lighting in their homes. Housing units that are occupied by owners were significantly more likely to report having CFL or LED bulbs compared with renter-occupied housing units (89% versus 79%).
- Although the cost of LEDs has fallen dramatically, the upfront cost of newer bulb technologies, particularly LEDs, is often higher than for incandescent bulbs, and higher-income households have adopted efficient bulbs at a faster rate. Households where the annual income is $100,000 or more were significantly more likely to report having CFL or LED bulbs, compared with those where the annual income is less than $20,000 (93% versus 75%, respectively). The difference in LED adoption alone was even greater: 45% of households with annual incomes of at least $100,000 reported having at least one LED bulb, compared with 14% of households with annual incomes less than $20,000.
- Updating a home’s lightbulbs may be a common suggestion made in an energy audit: 95% of homes that had an energy audit reported having CFL or LED bulbs, compared with 85% of homes that did not have an energy audit. Only 7% of U.S. households reported having an energy audit conducted.
More information about the energy-consuming equipment in U.S. homes is available in the 2015 RECS housing characteristics data tables. Information about energy consumption and expenditures is scheduled for release in early 2018.
Principal contributors: Maggie Woodward, Bill McNary