
U.S. average gasoline price falls below $2.00 per gallon for first time since 2009
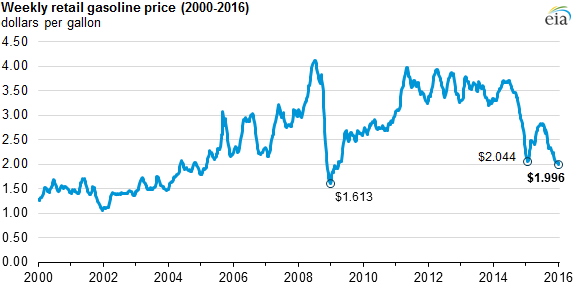
Based on EIA's weekly survey of gasoline prices, the U.S. average retail price for regular gasoline fell to $1.996 per gallon (gal) on January 11, falling below $2.00/gal for the first time since March 23, 2009. The U.S. average retail regular gasoline price had last approached, but not gone below, the $2.00 mark in early 2015. Falling gasoline prices are a result of falling crude oil prices and the seasonal slowdown in gasoline demand.
Four of the five regions in the United States currently have averages below $2.00/gal, with the exception of the West Coast, where the retail regular gasoline price averaged $2.63/gal on January 11. Gasoline prices on the West Coast tend to be higher than elsewhere in the country because of the region's relative isolation from other gasoline markets and higher state taxes. Additionally, gasoline supply chains on the West Coast are adjusting to several refinery outages that occurred in 2015, which tightened gasoline supplies and increased prices.
During the recent decline in gasoline prices that began this fall, the U.S. Gulf Coast was the first region where prices were below $2.00/gal, which occurred in late October. Average gasoline prices in the Midwest and the Rocky Mountains fell below $2.00/gal in November and December, respectively. The East Coast average gasoline price was $1.999/gal as of January 4, 2016, making it the most recent region with a sub-$2.00/gal gasoline price.
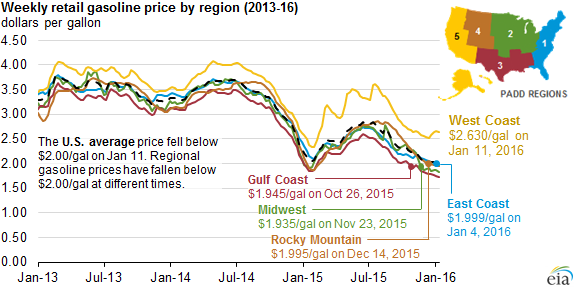
Note: PADDs are Petroleum Administration for Defense Districts.
EIA surveys a statistically representative sample of 802 stations across the United States each week for gasoline prices. Stations are surveyed each Monday morning and report their self-serve cash-only prices, including all taxes, as of 8:00 a.m. local time that day. Survey results are reported in the Gasoline and Diesel Fuel Update later that day, one of the quickest turnaround times of any government survey.
Average gasoline prices reported by EIA represent a specific point in time for three grades of gasoline and two formulations. EIA's reported prices differ from AAA and GasBuddy averages that do not represent a specific point in time and do not provide separate prices by gasoline formulation, such as reformulated or conventional gasoline. AAA's Daily Fuel Gauge Report is updated daily by the Oil Price Information Service (OPIS) based on credit card transactions at up to 120,000 stations. GasBuddy largely relies on user-reported gasoline prices around the country.
As discussed in the Short-Term Energy Outlook released earlier this week, EIA expects gasoline prices to remain relatively low throughout 2016, reaching a seven-year low of $1.90/gal in February before rising during the spring, and averaging $2.03/gal for the year. Gasoline prices are expected to increase slightly in 2017, averaging $2.21/gal through the year.
Principal contributors: Mason Hamilton, Amerine Woodyard
Tags: crude oil, gasoline, liquid fuels, prices