
Natural gas use features two seasonal peaks per year
Note: Does not include natural gas as a vehicle fuel.
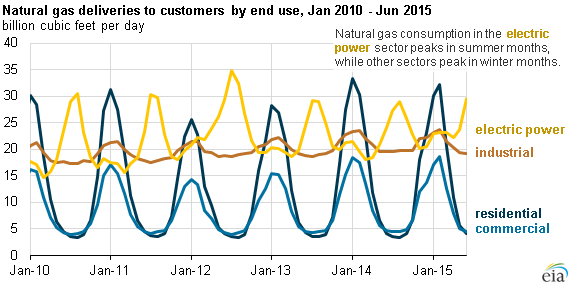
Use of natural gas has two seasonal peaks, with consumption patterns predominantly driven by weather. The largest peak occurs during the winter, when cold weather increases the demand for natural gas space heating in the residential and commercial sectors. A second, smaller peak occurs in the summer when air conditioning use increases demand for electric power, an increasing portion of which is provided by natural gas-fired generators.
The electric power sector is the largest consumer of natural gas, having surpassed the industrial sector in 2009. Consumption of natural gas in the power sector peaks in the summer when demand for electricity is highest. A smaller peak occurs during the winter, while the spring and fall seasons have the lowest consumption of natural gas for electric power.
Monthly data for 2010 through 2014 show deliveries of natural gas to the electric power sector averaged 23 billion cubic feet per day (Bcf/d), ranging from about 30 Bcf/d in the summer peak to 16 Bcf/d in the spring or fall. Increased deliveries of natural gas to the electric power sector have accounted for much of the growth in total natural gas deliveries.
Note: Does not include natural gas as a vehicle fuel.
Industrial users of natural gas exhibit the least seasonality, ranging from between 22 Bcf/d during the winter and 18 Bcf/d in the summer. Although industrial natural gas consumption had been declining, down from 23 Bcf/d in 1997 to about 17 Bcf/d in 2009, industrial consumption has been rising over the past five years, reaching 21 Bcf/d in 2014.
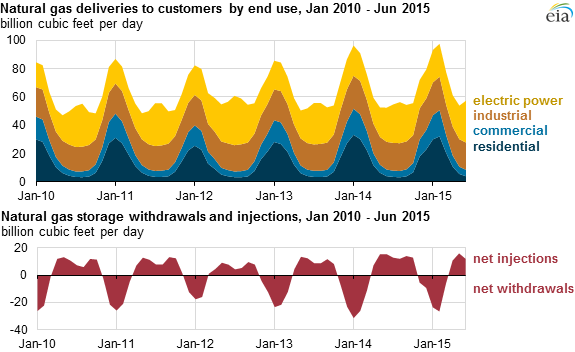
Residential and commercial natural gas use peaks during the winter, as these consumers use natural gas primarily for space heating. During winter months, natural gas delivered to the residential and commercial sectors accounted for more than 50% of all natural gas delivered for end uses in the United States. The seasonal effect in the residential sector is about twice as great as in the commercial sector. Natural gas deliveries in the residential sector can range from more than 30 Bcf/d in winter months to about 3 Bcf/d in the summer. In the commercial sector, deliveries range from 16 Bcf/d in the winter to 4 Bcf/d in the summer.
Natural gas is also used to fuel water heaters, cookstoves, dryers, and other equipment in the residential sector. The commercial sector has the same uses, as well as natural gas space cooling and combined heat and power applications. These uses generally make up most of the natural gas consumption for these sectors in warmer months.
To balance seasonal swings in use, natural gas is placed in storage. Natural gas storage levels tend to be highest sometime between the end of October and mid-November and lowest at the end of winter. EIA's Weekly Natural Gas Storage Report shows that most injections occur between April and October and most withdrawals occur between November and March.
Principal contributor: Scott Bradley