
Rail helps make Midwest a net shipper of crude oil
Note: Data for 2015 are averaged through May. PADD is Petroleum Administration for Defense District.
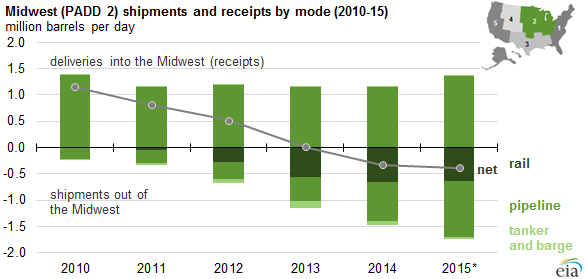
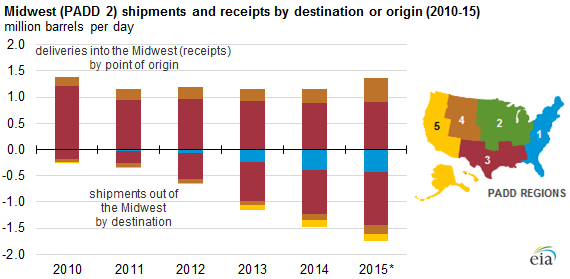
Shipments of crude oil out of the Midwest region (Petroleum Administration for Defense District 2) to other U.S. regions have steadily increased as a result of pipeline reversals and rail transport. Rail movements out of the Midwest contributed to the region becoming a net shipper of crude oil. Without these rail movements, the Midwest region would still be a net recipient. The Midwest started to ship more crude oil to other regions than it received from those regions for a few months in 2013 and on an annual basis in 2014. The most recent Petroleum Supply Monthly, which contains data through May 2015, shows an average of 1.7 million barrels per day (b/d) shipped out of the Midwest during the first five months of the year, of which 638,000 b/d were transported by rail.
Between 2010 and mid-2012, pipeline shipments out of the Midwest were relatively flat at about 225,000 b/d until the reversal of the Seaway Pipeline, which now transports crude oil from Cushing, Oklahoma, to the Gulf Coast (PADD 3). Since then, Seaway has been expanded, and other pipelines, such as TransCanada's Gulf Coast Pipeline, were built to carry crude oil out of the Midwest. By May 2015, pipeline shipments from the Midwest reached 1.3 million b/d, the highest since EIA began collecting pipeline shipment data in 1986.
Crude-by-rail (CBR) volumes from the Midwest to the East Coast began to increase in 2012 as production increased in the Bakken region of North Dakota. The largest annual average CBR movement from 2011 to 2013 was from the Midwest to the Gulf Coast (PADD 2 to PADD 3). Midwest-to-Gulf Coast CBR movements started to decline in the second half of 2013 as less Bakken crude oil made its way down to the Gulf Coast because pipelines in the Permian Basin in Texas and New Mexico were built, expanded, or reversed to take Permian crude oil production to Gulf Coast refineries. As Midwest-to-Gulf Coast CBR shipments decreased, Midwest CBR shipments to the East and West Coast (PADD 1 and PADD 5, respectively) increased to transport the steadily increasing crude oil production in the Midwest.
Note: Data for 2015 are averaged through May. PADD is Petroleum Administration for Defense District.
Principal contributor: Arup Mallik