
U.S. petroleum product exports increase for 13th consecutive year, setting record
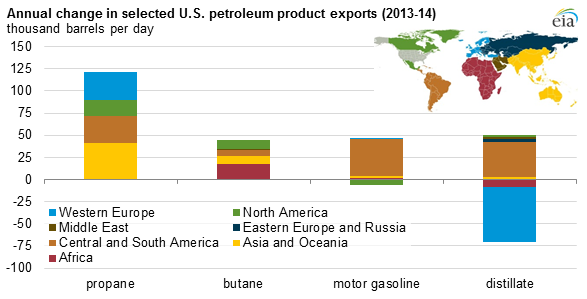
U.S. exports of noncrude petroleum products from the United States averaged a record 3.8 million barrels per day (bbl/d) in 2014, an increase of 347,000 bbl/d from 2013, based on data from EIA's Petroleum Supply Monthly. In particular, exports of motor gasoline, propane, and butane increased, offsetting a decrease in distillate exports.
As detailed in This Week in Petroleum, the combination of record-high U.S. refinery runs (which averaged 16.1 million bbl/d in 2014) and increased global demand for petroleum products allowed U.S. petroleum product exports to increase for the 13th consecutive year. These exports are mostly sent to nearby markets in Central America and South America, followed by exports to other countries in North America (Canada and Mexico). U.S. petroleum product exports increased in every region except the Middle East, which declined from 55,000 bbl/d in 2013 to 47,000 bbl/d in 2014. However, in 2014, there was more change—both in quantity exported and destination—for specific products: motor gasoline, propane, butane, and distillate.
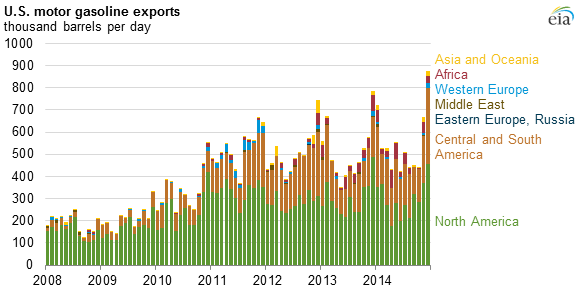
December 2014 exports of motor gasoline, which include finished gasoline and gasoline blending components, set a monthly record of 875,000 bbl/d. For the past several years, monthly exports of gasoline have been highest in November and December, as low seasonal U.S. gasoline demand in December creates a larger surplus of gasoline, particularly on the U.S. Gulf Coast (as defined by Petroleum Administration for Defense District 3), resulting in increased exports to relatively farther destinations in Africa and Asia. Still, most U.S. motor gasoline exports are sent to Canada and Mexico.
Increased U.S. production and capacity to export hydrocarbon gas liquids (HGL), particularly on the U.S. Gulf Coast, allowed exports of propane and butane in 2014 to increase by 121,000 bbl/d (40%) and 44,000 bbl/d (149%), respectively, over 2013 levels. Exports of propane to Asia, particularly Japan and China, where the fuel is used in cooking, heating, transportation, and as a petrochemical feedstock, nearly doubled in 2014 from 2013, increasing by 40,000 bbl/d (95%).
Exports of butane, which shares some uses with propane but is more suitable for use in warmer climates, grew to 74,000 bbl/d. In 2014, the United States exported 20,000 bbl/d of butane to Africa, an increase of 17,200 bbl/d (628%) from a year earlier, making Africa now the largest recipient for U.S. exports of butane.
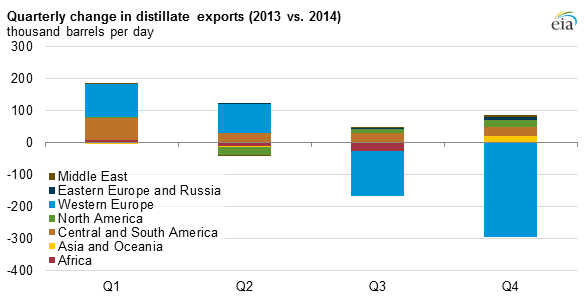
U.S. distillate exports declined for the first time since 2004. Almost all of this decrease is attributable to declines in exports to Western Europe and Africa, where distillate exports fell by 61,000 bbl/d (15%) and 8,700 bbl/d (35%), respectively, in 2014. In the second half of the year, increased European refinery runs, exports from recently upgraded Russian refineries, and new refinery capacity in the Middle East increased supply to European distillate markets, reducing the need for distillate from the United States.
Principal contributor: Mason Hamilton