
Wholesale electricity prices rose across the United States
Note: On-peak hours are weekdays from 7 a.m. to 11 p.m.
Note: Click to enlarge.
Republished: July 29, 2013: Text was modified to clarify content.
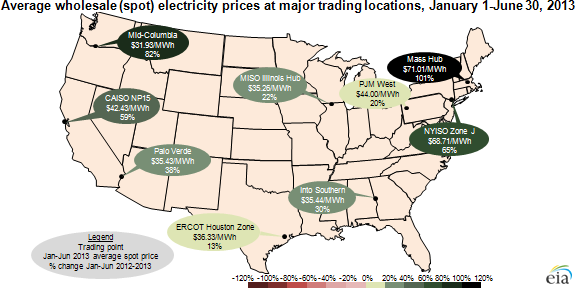
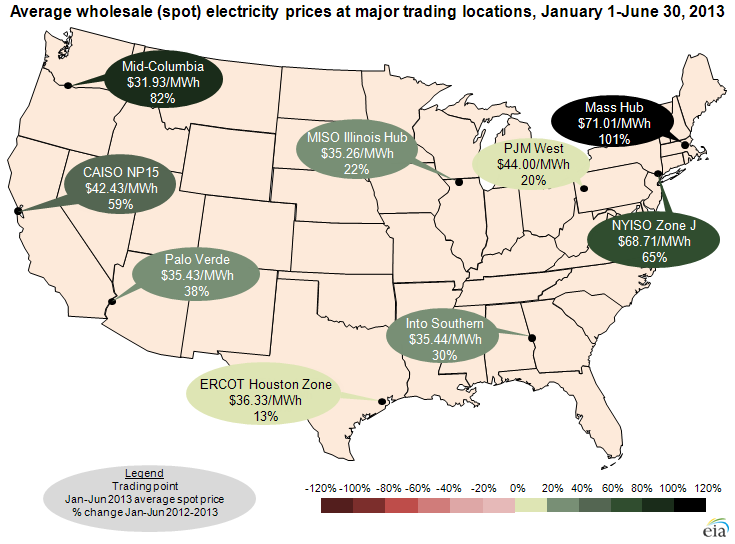
Average on-peak, day-ahead wholesale electricity prices rose in every region of the Lower 48 states in first-half 2013 compared to first-half 2012. The most important factor was the rise in the price of natural gas (the marginal fuel for generation in much of the nation) in 2013 compared to 10-year lows in April 2012. However, the increase in power prices was not uniform across electric markets as regional natural gas supply issues drove larger increases in the Northeast and Pacific Northwest.
Prices in New England were the highest in the nation mostly because of pipeline constraints that limited the delivery of natural gas. This factor drove electricity prices in New England and New York above $200 per megawatthour (MWh) for several days this winter.
In the Northwest, a decline in precipitation reduced hydroelectric generation and made the region more dependent on gas-fired power than in the first half of 2012. The combination of more reliance on natural gas and higher natural gas prices drove power prices 82% higher in the Northwest compared to the first half of 2012.
The California power market also experienced a large (59%) increase in wholesale power prices. As with the rest of the nation, this increase was largely the result of higher natural gas prices. The ongoing outage of the San Onofre Nuclear Generating Station (SONGS) contributed to a continued separation in power prices between the northern and southern parts of the state's electric system.
Prices in Texas increased less than much of the rest of the nation, largely because of the mild weather this spring. In April 2012, wholesale prices in Texas spiked because of a sharp increase in temperature near the end of the month. With milder temperatures throughout the first half of 2013 in Texas, there were no short-term price increases in the wholesale power market.
Trends in power prices in the rest of the nation were generally set by higher natural gas prices, which is the marginal fuel for electric generation in most regions. Spot natural gas prices at major hubs across the nation increased between 42% and 146% between the first half of 2012 and the first half of 2013.
As of July 22, power prices at major U.S. trading hubs ranged from $35-65/MWh, very similar to last year at this time, except for the Pacific Northwest, where prices were about $25/MWh.
Tags: electricity, map, natural gas, prices