U.S. Energy Information Administration logo
Skip to sub-navigation
October 1, 2012

U.S. marketed natural gas production levels off in the first half of 2012
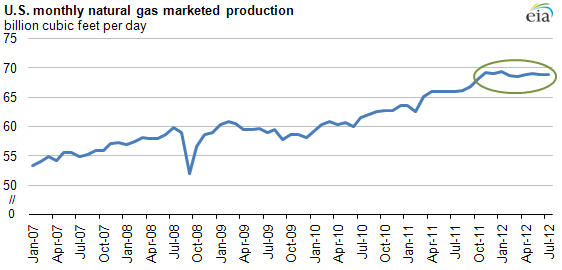
Graph of U.S. monthly natural gas production, as explained in article text
Source: U.S. Energy Information Administration, Natural Gas Monthly

U.S. marketed natural gas production has flattened since late 2011, mainly in response to lower natural gas prices. Nevertheless, volumes remain at historically high levels. From January through July 2012, marketed natural gas production set a record high for the first seven months of any year, averaging 68.9 billion cubic feet per day (Bcf/d), up nearly 4 Bcf/d, or 5.9%, from the same period a year earlier.

While production was higher for each month from January through July 2012 compared to the same month a year earlier, monthly production has remained close to its level at the end of 2011. Data for August 2012 will likely show a significant drop in average daily production as Hurricane Isaac shut in many offshore wells for several days.

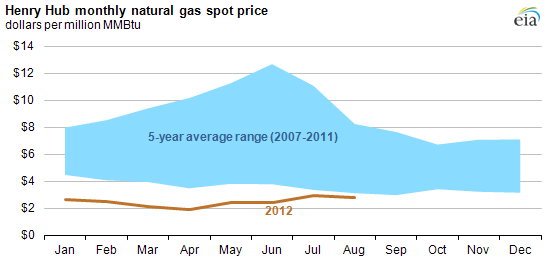
Due in part to lower natural gas prices and comparatively high prices for natural gas liquids, some producers increasingly targeted liquids-rich portions of shale formations, contributing to the overall flattening of natural gas production.
Graph of U.S. monthly natural gas price at Henry Hub, as explained in article text
Source: U.S. Energy Information Administration based on Bloomberg, L.P.

Statistics
Analysis
Tools
Education
News

Petroleum & Other Liquids

Crude oil, gasoline, heating oil, diesel, propane, and other liquids including biofuels and natural gas liquids.

Natural Gas

Exploration and reserves, storage, imports and exports, production, prices, sales.

Electricity

Sales, revenue and prices, power plants, fuel use, stocks, generation, trade, demand & emissions.

Coal

Reserves, production, prices, employment and productivity, distribution, stocks, imports and exports.

Nuclear & Uranium

Uranium fuel, nuclear reactors, generation, spent fuel.

Renewable & Alternative Fuels

Includes hydropower, solar, wind, geothermal, biomass and ethanol.

EIA Survey Forms

Forms EIA uses to collect energy data including descriptions, links to survey instructions, and additional information.

Total Energy

Comprehensive data summaries, comparisons, analysis, and projections integrated across all energy sources.

U.S. States

State energy information, including overviews, rankings, data, and analyses.

International

International energy information, including overviews, rankings, data, and analyses.

Environment

Greenhouse gas data, voluntary reporting, electric power plant emissions.

Data Tools, Apps, & Maps

Tools to customize searches, view specific data sets, study detailed documentation, and access time-series data.

Open Data

EIA's free and open data available as API, Excel add-in, bulk files, and widgets

EIA Beta

Come test out some of the products still in development and let us know what you think!

Open Source Code

EIA's open source code, available on GitHub.

RSS Feeds

Subscribe to feeds for updates on EIA products including Today in Energy and What's New.