
Working natural gas stocks end refill season near previous five-year average
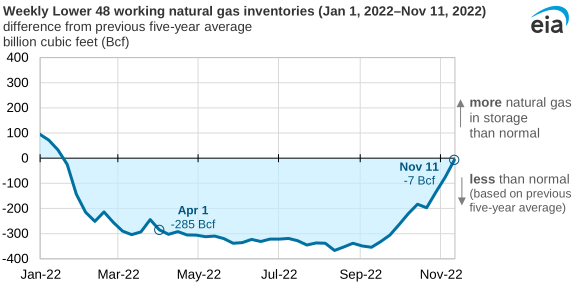
Working natural gas stocks reached 3,644 billion cubic feet (Bcf) as of November 11, 2022, according to the Weekly Natural Gas Storage Report, nearly matching the five-year average, and exceeded the year-ago level for this time of year. The deficit to the five-year average totaled 7 Bcf (0.2%) as of November 11—its lowest level since last January. An increase in injections during the final weeks of the refill season (April 1–October 31) reversed what had been a below-average year for storage injections.
Two factors increased injections of natural gas into storage this refill season:
- Growth in U.S. dry natural gas production exceeded growth in domestic natural gas consumption plus exports.
- The fire and resulting shut-in at the Freeport liquefied natural gas (LNG) facility in June reduced exports.
Start of the refill season—April 1
On April 1, working natural gas stocks were 17%, or 285 Bcf, lower than the five-year average. Net injections into working natural gas fell short of the five-year average during most of the weeks that followed. As a result, the deficit to the five-year average grew to 367 Bcf during the week ending August 12, amid high temperatures and high demand for cooling. Increasing dry gas production during the summer and moderate temperatures since September 9, however, led to rapid change in the natural gas storage balance; weekly net injections exceeded their previous five-year averages in eight of the nine following weeks.
End of the refill season—October 31
The refill season ended 3% below year-ago and five-year averages. Injections this season, at 2,150 Bcf, were 16% higher than one year ago and 9% higher than the five-year average, which reduced the deficit.
Although the end of the refill season is October 31, the effective end of the refill season occurs in mid-November because injections generally continue during the first few weeks of the heating season. Moderate temperatures during the first couple of weeks in November contributed to continued larger-than-average injections.
Principal contributor: Jose Villar