
U.S. exported record amounts of liquefied natural gas in 2021
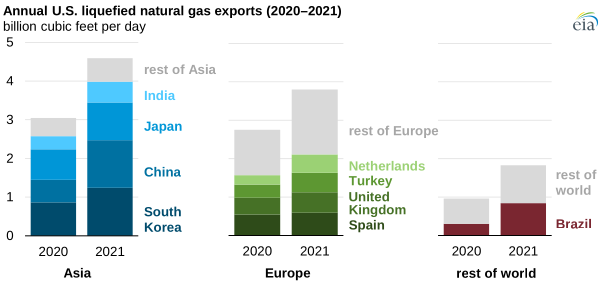
U.S. exports of liquefied natural gas (LNG) set a record high in 2021, averaging 9.7 billion cubic feet per day (Bcf/d), according to our most recent Natural Gas Monthly. U.S. LNG exports increased by 50% from 2020. The increase in U.S. LNG exports was driven by increased demand in both Europe and Asia (particularly China) and by expanding U.S. liquefaction capacity. In 2021, liquefaction at the six U.S. LNG export terminals averaged 102% of nameplate (or nominal) capacity and 89% of peak capacity, according to our estimates.
In 2021, U.S. LNG exports to Asia increased by 1.5 Bcf/d (51%). Last year, the United States became the third-largest LNG supplier to Asia, accounting for 12% of all LNG imports into Asia, after Australia (29%) and Qatar (21%), according to our estimates based on data from CEDIGAZ.
South Korea and China were nearly tied as the top two destinations for U.S. LNG exports, at 1.2 Bcf/d each. The increase in U.S. LNG exports to China (by 0.6 Bcf/d) was the largest increase among all destinations for U.S. LNG exports last year. Since China lowered tariffs on imports of LNG from the United States from 25% to 10% in 2019, U.S. LNG imports into China have increased. Japan was the third-largest importer of U.S. LNG in 2021, at 1.0 Bcf/d. Combined, these three countries accounted for 35% of all U.S. LNG exports in 2021.
European countries (including Turkey) were the destination of 3.3 Bcf/d of LNG imported from the United States during 2021—an increase of 0.8 Bcf/d (32%) compared with 2020. U.S. LNG exports to Europe increased in March and April 2021 following a cold winter in Europe, which significantly reduced the region’s natural gas held in storage. U.S. LNG exports to Europe declined in subsequent months as higher spot prices in Asia attracted larger volumes of flexible U.S. LNG supplies to Asia.
During the fourth quarter of 2021, U.S. LNG exports to Europe increased again as Europe’s natural gas storage inventories remained low and spot prices for natural gas in Europe exceeded those in Asia. The United States exported 6.7 Bcf/d of LNG to Europe in December 2021—a record volume that has since been surpassed in both January and February 2022.
U.S. LNG exports to Brazil increased by 0.5 Bcf/d in 2021 compared with 2020, averaging 0.8 Bcf/d on an annual basis. Last year, Brazil experienced its worst drought in more than 90 years, which limited hydroelectric power generation and led to more consumption of natural gas for electricity generation.
Principal contributor: Victoria Zaretskaya