
U.S. natural gas exports to Mexico established a new monthly record in June 2021
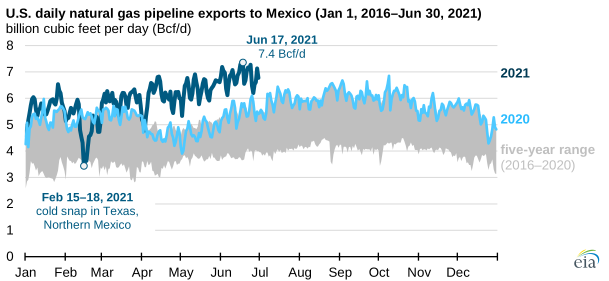
Natural gas pipeline exports from the United States to Mexico surpassed 7 billion cubic feet per day (Bcf/d) on multiple days during June, according to data from Wood Mackenzie. The highest amount of pipeline exports, 7.4 Bcf/d, was sent out on June 17.
Over the past few years, Mexico has expanded its natural gas pipeline infrastructure and has relied increasingly on imported natural gas from U.S. pipelines. Pipeline imports accounted for 76% of Mexico’s total natural gas supply in June 2021, compared with 40% in June 2015. Mexico has reduced both its natural gas production and imports of liquefied natural gas (LNG) as a share of its total natural gas supply.
U.S. natural gas pipeline exports to Mexico averaged 6.8 Bcf/d in June 2021, up 25% from June 2020 and 44% more than the previous five-year (2016–2020) monthly average. We expect these record-high flows, which were driven by increased power demand, high temperatures, and greater industrial demand in June, to continue through the summer.
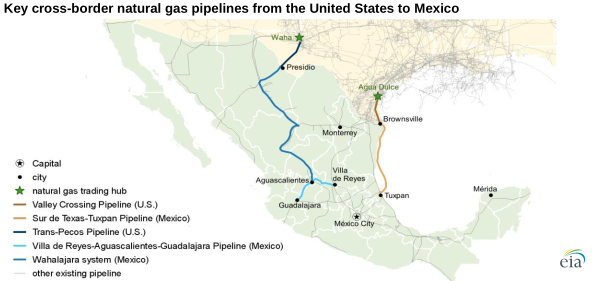
New pipeline additions that went into service during 2020 and in the first half of 2021 increased the volume of natural gas flowing to natural gas-fired power plants, industrial plants, and pipeline interconnections throughout Mexico. Two cross-border pipelines drove the growth: the Sur de Texas-Tuxpan Pipeline, which has a capacity of 2.6 Bcf/d and delivers natural gas from the U.S. border at Brownsville, Texas, to Tuxpan in Veracruz, Mexico, and the Trans-Pecos Pipeline (part of the Wahalajara system), which has a capacity of 1.4 Bcf/d and delivers natural gas to the U.S. border at Presidio, Texas.
The Sur de Texas-Tuxpan Pipeline increased flows to an estimated 1.7 Bcf/d in June 2021, compared with year-ago levels of 0.8 Bcf/d. The pipeline’s volume increased because of expanded infrastructure in Mexico, which has allowed more natural gas to flow to power plants in the Mexico City region and to Mérida markets in the Yucatán Peninsula.
The Trans-Pecos Pipeline increased flows to the Wahalajara pipeline system to 0.8 Bcf/d, compared with year-ago levels of 0.2 Bcf/d. This pipeline connects the Waha Hub in West Texas to Guadalajara and other population centers in West-Central Mexico. Some of this increase is the result of the increased flow capacity on the Villa de Reyes-Aguascalientes-Guadalajara Pipeline (VAG) in Central Mexico and subsequent delivery points that entered service when the pipeline was completed in October 2020.
Because of increased access to natural gas imports, Mexico has increased its use of natural gas to generate electricity. Power plants in Mexico used about 4.9 Bcf/d of natural gas for power generation in June, up 19% compared with last year. Seasonally high temperatures in areas of Northern and Central Mexico during parts of June also increased demand for electricity. Industrial sector natural gas demand reached 3.3 Bcf/d in June, up 31% compared with last year, largely driven by the return to pre-pandemic demand levels and the reversal of related economic effects.
Principal contributors: Max Ober, Katie Dyl
Tags: international, natural gas, pipelines, Texas, exports/imports, United States, states, Mexico, map