
In 2020, natural gas exports and natural gas for electricity reached record highs
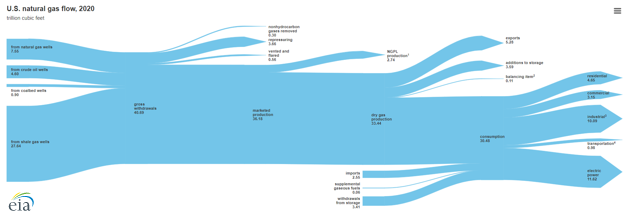
Note: Click for full U.S. natural gas flow 2020 diagram.
In 2020, both natural gas consumption by the U.S. electric power sector and natural gas exports reached record highs, despite a 2% annual decline in domestic dry natural gas production. Dry natural gas production doesn’t include natural gas plant liquids (NGPL), such as ethane and propane. In 2020, NGPL production grew to a record-high 2.7 trillion cubic feet (Tcf), up 7% from 2019. Our U.S. natural gas flow diagram shows the volume of U.S. natural gas supply (production, imports, and withdrawals from storage) and disposition (consumption, exports, and additions to storage) in 2020.
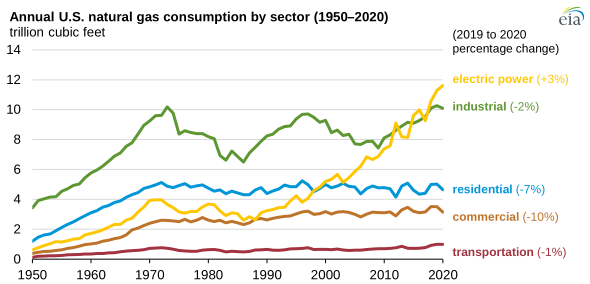
Natural gas consumption in the U.S. electric power sector grew to a record-high 11.6 Tcf in 2020, up 3% compared with 2019. The U.S. electric power sector has consumed more natural gas than any other sector in five of the past six years. Electric power was the only sector that increased its natural gas consumption in 2020.
Natural gas has become an increasingly important source of energy for U.S. electricity over the past several years. Natural gas has remained the primary source of electricity generation in the United States since it surpassed coal in 2016. More than 100 coal plants have been replaced with or converted to natural gas since 2011.
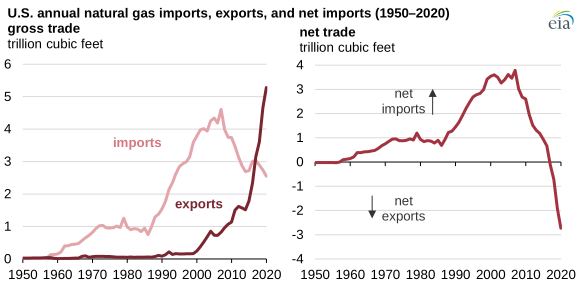
U.S. natural gas exports increased to a record-high 5.3 Tcf in 2020, up 13% compared with 2019. U.S. exports of natural gas have grown substantially over the past decade, and in 2017, exports surpassed imports of natural gas for the first time since 1957. About 55% of U.S. natural gas exports in 2020 were sent by pipeline to Mexico and Canada. Most of the rest was shipped overseas as liquefied natural gas (LNG). Mexico receives more U.S. natural gas exports than any other country, and U.S. natural gas exports to Mexico reached a record high of 2.0 Tcf in 2020. U.S. LNG exports also increased to a record high in 2020, and almost half went to Asia. Natural gas imports in 2020 decreased to less than 2.6 Tcf, the lowest level since 1993. Nearly all U.S. natural gas imports originate from Canada.
U.S. dry natural gas production in 2020 decreased 2% compared with 2019 to 33.4 Tcf, in part because of warmer weather, lower natural gas prices, and economic impacts related to the COVID-19 pandemic. Natural gas production in the United States has generally increased over the past decade because of widespread adoption of horizontal drilling and hydraulic fracturing techniques that allow operators to more economically produce natural gas from shale formations.
Principal contributor: Mickey Francis