
Natural gas-fired generation has increased in most U.S. regions since 2015
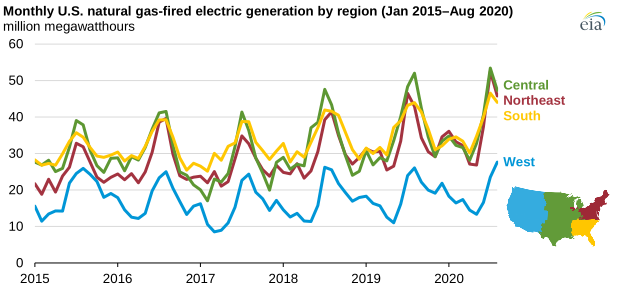
Note: Central consists of the Electric Reliability Council of Texas (ERCOT), Southwest Power Pool (SPP), and Midcontinent Independent System Operator (MISO). South consists of Southeastern Electric Reliability Council (SERC) and Florida. Northeast consists of New York Independent System Operator (NYISO), Independent System Operator New England (ISO-NE), and PJM Interconnection (PJM). West consists of California, Northwest, and Southwest.
Natural gas-fired generation has generally increased in most U.S. regions since 2015, according to data from the U.S. Energy Information Administration’s (EIA) Power Plant Operations Report. Annual electricity generation from natural gas power plants in the United States increased by 31% in the Northeast region, by 20% in the Central region, and by 17% in the South region between 2015 and 2019. In the West region of the continental United States, electric power generation from natural gas power plants remained relatively flat during the same period.
Through November 2020, the Central, South, and Northeast regions have generated similar amounts of electricity from natural gas power plants. Of these regions, the Central region, which includes three independent system operators, had the largest seasonal summer peak in natural gas-fired generation, reaching 53 million megawatthours (MWh) for the month of July 2020, which is 37% more than the 2015 summer peak month.
Growing natural gas-fired generation reflects an increase in natural gas-fired generating capacity. Between 2015 and 2019, nearly 35 gigawatts (GW) of net summer capacity entered service, according to EIA’s latest Electric Power Annual, which was an 11% increase during that five-year period. Most of this new natural gas-fired capacity was added in the Northeast region, particularly in the PJM Interconnection.
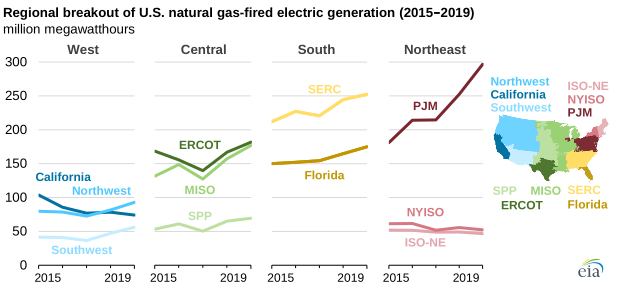
The largest increases in U.S. natural gas-fired generation have occurred in the Central and Northeast regions, near the natural gas production area in Appalachia in states such as Ohio, Pennsylvania, and West Virginia. Relatively low natural gas prices have made it more economical to generate electricity using natural gas instead of coal. This trend has been most pronounced in regions with competition between coal and natural gas generators, particularly in the Midcontinent Independent System Operator's (MISO) area in the Central region and the PJM Interconnection in the Northeast region.
When natural gas and coal are similarly priced on a cost-per-energy-content basis, most natural gas-fired generators can produce electricity more efficiently than coal-fired generators, providing an economic advantage in electricity markets.
In the West region, growth in natural gas-fired generation declined 1% between 2015 and 2019. Natural gas-fired generation over that period in California declined 30 million MWh (29%), offsetting the combined growth of 28 million MWh in natural gas-fired generation from the Northwest and Southwest subregions.
Principal contributor: Stephen York
Tags: generation, electricity, natural gas, map