
U.S. customers experienced an average of nearly six hours of power interruptions in 2018
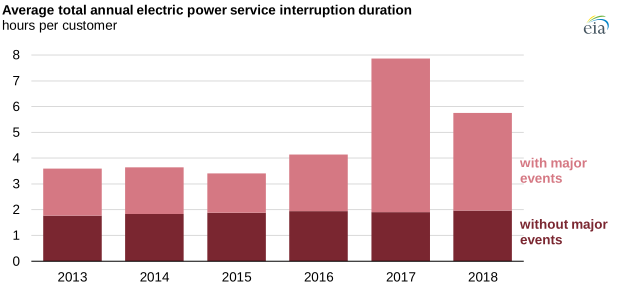
Interruptions in electricity service vary in frequency and duration across the nearly 3,000 electric distribution systems in the United States. Power interruptions are caused by many factors, including weather, vegetation patterns, and utility practices. In 2018, power outage durations for U.S. electricity customers averaged 5.8 hours per customer.
One way to measure the reliability of electric utilities is the System Average Interruption Duration Index (SAIDI) metric, which is the total time an average customer experiences a non-momentary power interruption during a year. For utilities that report SAIDI metrics using Institute of Electrical and Electronics Engineers (IEEE) standards, non-momentary interruptions are those lasting longer than five minutes. Although the terms outage and interruption are often used interchangeably, IEEE defines an outage as a component's inability to deliver power and an interruption as the result of one or more of those equipment outages. In that sense, not all outages result in interruption of service to customers, depending on how the system is configured.
Utilities can report interruption duration values with major events (such as snowstorms, hurricanes, floods, or heatwaves) without major events (or after removing the effects of major events), or both. In 2018, the U.S. Energy Information Administration (EIA) produced an informational video on electricity reliability metrics.
Since EIA began collecting reliability data in 2013, U.S. electricity customers have consistently experienced average total power interruptions of about two hours (106 minutes to 118 minutes) per year when major events are excluded. In 2017 and 2018, however, customers experienced longer outages, driven by increases in interruptions with major events. In 2017, the average electricity outage duration with major events was twice as long as in previous years. This increase was largely a result of higher numbers of hurricanes, wildfires, and severe storms that year.
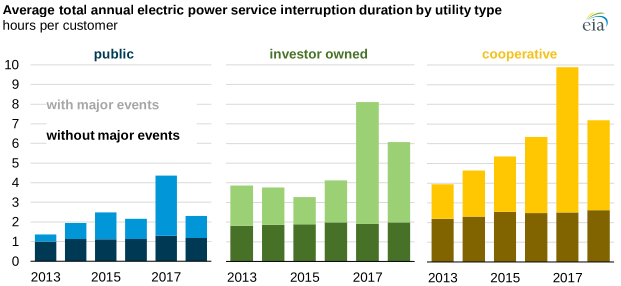
EIA collects data on the frequency and duration of power outages for three main types of electric distribution utilities: investor-owned utilities (IOU), which are owned by shareholders; cooperative energy utilities (co-ops), which are owned by members of the cooperative; and public utilities, which are owned by government entities such as municipalities, regional authorities, and states.
When major events are excluded, power interruption durations for each of the three utility types remain relatively constant over time. Publicly-owned utility customers experienced the most reliability, averaging about one hour of interrupted electric service annually since 2013.
IOU customers averaged slightly less than two hours of interrupted service, and cooperative customers averaged about two-and-a-half hours of interrupted service. Although customers of all three utility types experience longer outage durations when major events are included, the same reliability ranking prevails, with publicly-owned utility customers experiencing the highest reliability, followed by IOU and co-op customers.
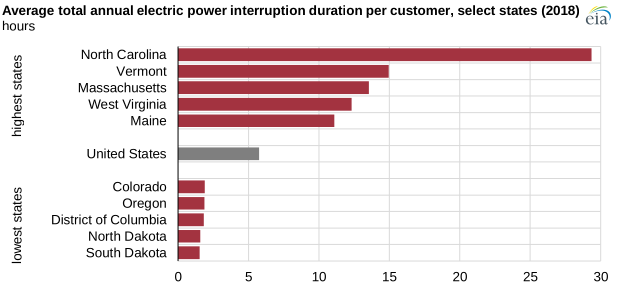
In 2018, year-average power interruption durations ranged from just 1.5 hours in South Dakota to nearly 30 hours in North Carolina. In the five states with the longest total annual power interruptions per customer, major weather events such as winter storms and hurricanes caused significant disruptions to electric power service. North Carolina was hit by both Hurricane Florence and Hurricane Michael in 2018, resulting in lengthy outages. Maine, Vermont, Massachusetts, and West Virginia are heavily forested states where power interruptions resulting from falling tree branches are common, especially as a result of winter ice and snowstorms that weigh down tree limbs and power lines.
Principal contributors: Anodyne Lindstrom, Sara Hoff
Tags: electricity, outages, utility