
U.S. liquefied natural gas exports quadrupled in 2017
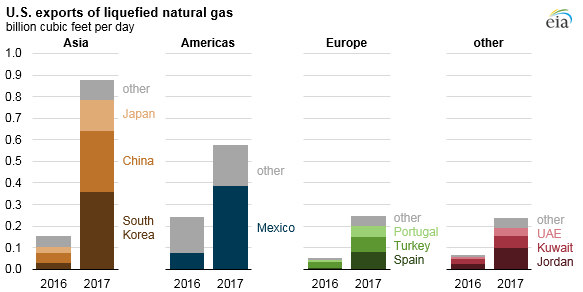
U.S. exports of liquefied natural gas (LNG) reached 1.94 billion cubic feet per day (Bcf/d) in 2017, up from 0.5 Bcf/d in 2016. As LNG exports increased, shipments went to more destinations. U.S. LNG exports in 2017, all of which originated from Louisiana’s Sabine Pass liquefaction terminal, reached 25 countries.
More than half (53%) of U.S. LNG exports in 2017 were shipped to three countries: Mexico, South Korea, and China. Mexico received the largest amount of U.S. LNG exports, at 20% of the 2017 total. Growing natural gas demand in Mexico, particularly from the power generation sector, and delays in the construction of domestic pipelines connecting to U.S. export pipelines led Mexico to rely on LNG imports to supplement imports of natural gas by pipeline.
In Asia, the widening difference between the Henry Hub natural gas price—to which U.S. LNG contract prices are indexed—and crude oil—to which LNG prices are benchmarked in Asia—helped to drive increases in LNG imports from the United States. Exports to South Korea accounted for 18% of total U.S. LNG exports in 2017 and were part of long-term contracts between sellers Cheniere Energy and Shell and the Korean natural gas buyers—utilities KOGAS and KEPCO. Exports to China made up 15% of total U.S. LNG exports. These exports were sold mostly on a spot basis, with volumes in October, November, and December increasing as record-high LNG demand prompted China to seek additional LNG on the global spot market to supplement contracted volumes.
Almost 60% of U.S. LNG in 2017 was sold on a spot basis to more than 20 countries in Asia, North and South America, Europe, the Middle East and North Africa, and the Caribbean. Although liquefaction capacity at Sabine Pass is fully contracted under long-term contracts to various buyers, flexibility in those contracts’ destination clauses allows U.S. LNG to be shipped to any market in the world.
After countries in Asia and North America (Mexico), countries in Europe collectively accounted for the third-largest share of U.S. LNG exports. LNG imports by several European countries increased in 2017, driven by increased demand primarily from the power generation sector. South American LNG imports declined in 2017. Demand for natural gas in that region is highly variable and is affected by the availability of competing lower-cost natural gas supply and hydro generation output.
The increase in LNG exports over the past two years is the result of the continuing expansion of U.S. LNG export capacity. Two LNG projects—Sabine Pass in Louisiana and Cove Point in Maryland—have come online since 2016, increasing U.S. LNG export capacity to 3.6 Bcf/d.
Four more projects are scheduled to come online in the next two years: Elba Island LNG in Georgia and Cameron LNG in Louisiana in 2018, then Freeport LNG and Corpus Christi LNG in Texas in 2019. Once completed, U.S. LNG export capacity is expected to reach 9.6 Bcf/d by the end of 2019. As export capacity continues to increase, the United States is projected to become the third-largest LNG exporter in the world by 2020, surpassing Malaysia and remaining behind only Australia and Qatar.
Principal contributor: Victoria Zaretskaya