
Natural gas net imports in 2015 at lowest level since 1986
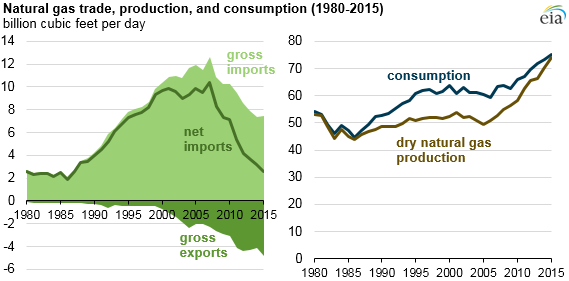
U.S natural gas net imports fell to 2.6 billion cubic feet per day (Bcf/d) in 2015, continuing a decline that began in 2007, when net imports of natural gas exceeded 10 Bcf/d. While both U.S. natural gas consumption and production have increased in recent years, natural gas production has grown slightly faster, resulting in a decline in net imports. Increasing domestic production of natural gas has reduced U.S. reliance on imported natural gas and kept U.S. natural gas prices relatively low.
Most U.S. imports of natural gas come by pipeline from Canada. A small and declining amount of imported liquefied natural gas (LNG) comes mainly from Trinidad. Most U.S. exports of natural gas are sent by pipeline to Mexico and Canada. The United States also exported LNG and compressed natural gas to several countries, but these volumes were relatively minimal in 2015. EIA's Short-Term Energy Outlook expects that the United States will become a net exporter of natural gas by mid-2017.
In recent years, increasing production from shale plays in the United States has resulted in an increase in U.S. natural gas exports. Since 2012, the natural gas pipeline industry has added 3.4 Bcf/d and 0.2 Bcf/d of export capacity to Mexico and Canada, respectively. As a result, U.S. natural gas exports to Mexico grew from 1.3 Bcf/d in 2011 to 2.9 Bcf/d in 2015. U.S. natural gas net imports from Canada have remained relatively stable since 2011.
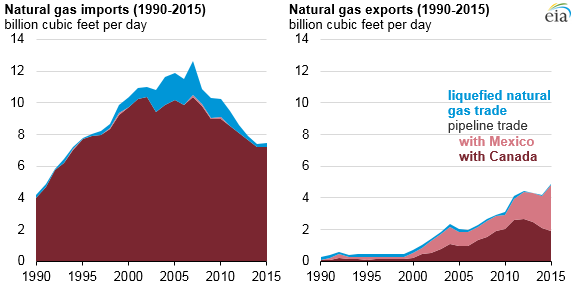
The natural gas industry plans to build 5.4 Bcf/d and 3.4 Bcf/d of additional export capacity to Canada and Mexico by 2019, respectively. Demand for additional export capacity from the United States to Canada and Mexico is driven by production growth in the United States and increasing demand in northern Mexico from power generators that use natural gas.
Before 2010, the United States was expanding its LNG import infrastructure. The natural gas industry built eight new LNG import terminals between 2005 and 2011: two in New England and six in the Gulf of Mexico. Net LNG imports accounted for 19% of total U.S. net imports of all natural gas in 2007, but LNG's share of imports fell to 7% in 2015. Certain parts of the United States, such as New England, continue to rely on LNG imports because of limited access to domestically produced natural gas. Other LNG terminals are adding liquefaction plants to provide LNG for exports. The Sabine Pass LNG liquefaction facility was completed earlier this year and made its first shipment (to Brazil) on February 24.
Principal contributor: Tu Tran