U.S. Energy Information Administration logo
Skip to sub-navigation
May 31, 2011

Coal stocks at power plants are likely sufficient despite river flooding

Share of coal transported by barge (2010) and days of coal burn (as of March 2011) for key States
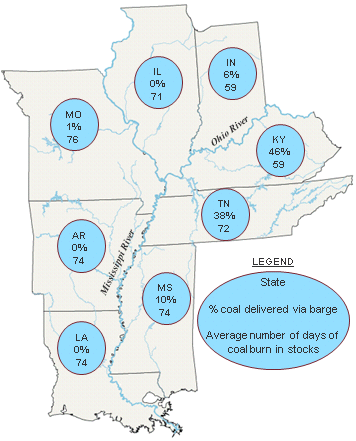
map of Share of coal transported by barge (2010) and days of coal burn (as of March 2011) for key states, as described in the article text

Source: U.S. Energy Information Administration, Electric Power Flash and Quarterly Coal Distribution Report
Note: Data are preliminary. Barged coal percentages are based on primary mode of transportation only. Louisiana, Arkansas, and Illinois reported no coal deliveries with River barge as the predominant mode of transportation. Days-of-burn is a forward-looking projection based on monthly consumption trends. In the case of Louisiana and Mississippi, the two States' days-of-burn data are combined. Data for Tennessee also include coal storage terminal receipts.
Download CSV Data

Flooding along the Mississippi and Ohio Rivers in late April and early May disrupted barge traffic in some areas, resulting in delayed coal deliveries to power plants. However, reliance on barge transportation for coal supplies varies by power plant and by State. Moreover, power plant operators in States affected by recent flooding (shown on the map) have on average between 59 to 76 days of coal supply in their stockpiles.

Among States in the flooded areas, Kentucky and Tennessee are the most dependent on barge transportation, accounting for about 46% and 38% of their overall coal supply needs. By contrast, power plant operators in other States affected by flooding rely primarily on rail and/or truck deliveries of coal. Many companies rely on multiple modes of transportation to get delivered coal.

Barge traffic disruptions have not resulted in material coal supply issues yet because coal-fired power plants maintain an inventory of coal in stockpiles, or may be able to get replacement coal via rail or truck. As of March 31, 2011, EIA estimates that coal-fired power plants in States identified in the map had an average of a two-to-three month supply of coal on hand.

Statistics
Analysis
Tools
Education
News

Petroleum & Other Liquids

Crude oil, gasoline, heating oil, diesel, propane, and other liquids including biofuels and natural gas liquids.

Natural Gas

Exploration and reserves, storage, imports and exports, production, prices, sales.

Electricity

Sales, revenue and prices, power plants, fuel use, stocks, generation, trade, demand & emissions.

Coal

Reserves, production, prices, employment and productivity, distribution, stocks, imports and exports.

Nuclear & Uranium

Uranium fuel, nuclear reactors, generation, spent fuel.

Renewable & Alternative Fuels

Includes hydropower, solar, wind, geothermal, biomass and ethanol.

EIA Survey Forms

Forms EIA uses to collect energy data including descriptions, links to survey instructions, and additional information.

Total Energy

Comprehensive data summaries, comparisons, analysis, and projections integrated across all energy sources.

U.S. States

State energy information, including overviews, rankings, data, and analyses.

International

International energy information, including overviews, rankings, data, and analyses.

Environment

Greenhouse gas data, voluntary reporting, electric power plant emissions.

Data Tools, Apps, & Maps

Tools to customize searches, view specific data sets, study detailed documentation, and access time-series data.

Open Data

EIA's free and open data available as API, Excel add-in, bulk files, and widgets

EIA Beta

Come test out some of the products still in development and let us know what you think!

Open Source Code

EIA's open source code, available on GitHub.

RSS Feeds

Subscribe to feeds for updates on EIA products including Today in Energy and What's New.