
More recycling raises average energy content of waste used to generate electricity
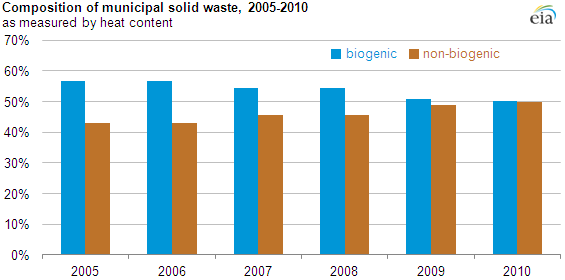
Most municipal solid waste (MSW) used to generate electricity contains both biogenic and non-biogenic components. As consumers recycle or recover more biogenic waste (such as food waste and yard clippings) and discard more non-biogenic waste (such as plastics and metals), the biogenic portion of municipal solid waste decreases. Since non-biogenic material has a higher heat content, the average heat content of MSW as a whole is increasing, making it a more efficient fuel for producing electricity.
At the end of 2011, there were 2,238 megawatts of MSW-fired electric generating capacity in the United States, providing about 0.3% of total U.S. generation. Some states consider MSW as a renewable resource eligible to meet Renewable Portfolio Standards (RPS); others provide partial or no credit towards RPS targets for MSW-fired generators. EIA divides the municipal solid waste stream into biogenic and non-biogenic components. Further, EIA identifies the biogenic component as renewable and the non-biogenic component as non-renewable.
The biogenic percentage of MSW continues to decrease, because of an increase in the consumption (and discarding) of non-biogenic materials, concurrent with the increased recovery of biogenic materials before they enter the waste stream as discards (more recycling). As a result, renewable energy generated by municipal solid waste continues to decrease as the consumption of plastics continues to go up, and biogenic waste is increasingly recovered and/or recycled.
The heat content of MSW materials varies significantly; non-biogenic components of the waste stream generally produce more heat when combusted than the biogenic components (see table). Therefore, changes in the composition of MSW can have significant effects in the heat content of the total waste stream.
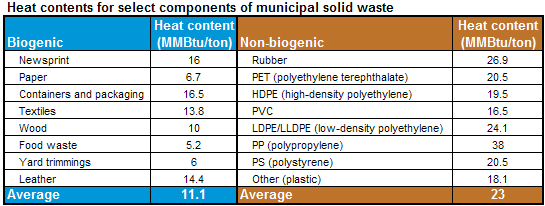
Analysis of the biogenic component of the waste stream shows that, while the heaviest component of that stream (food waste) saw relatively little change throughout the 2005-2010 time period, each year saw a decreasing amount of containers and packaging reaching the waste stream, due to increased recycling and recovery. Because containers and packaging have a much higher heat content than food waste, changes in the amount of containers and packaging have a greater effect on the total heat content, even though the weight may be less than that of food waste or other materials with lower heat contents.
Even more significant effects were seen in the non-biogenic component, with an increase in the weight content of energy-dense polypropylene resulting in a large increase in the heat content for the entire non-biogenic category.