
Rarely used oil, coal helped power New England during recent cold snap
Note: EST=eastern standard time
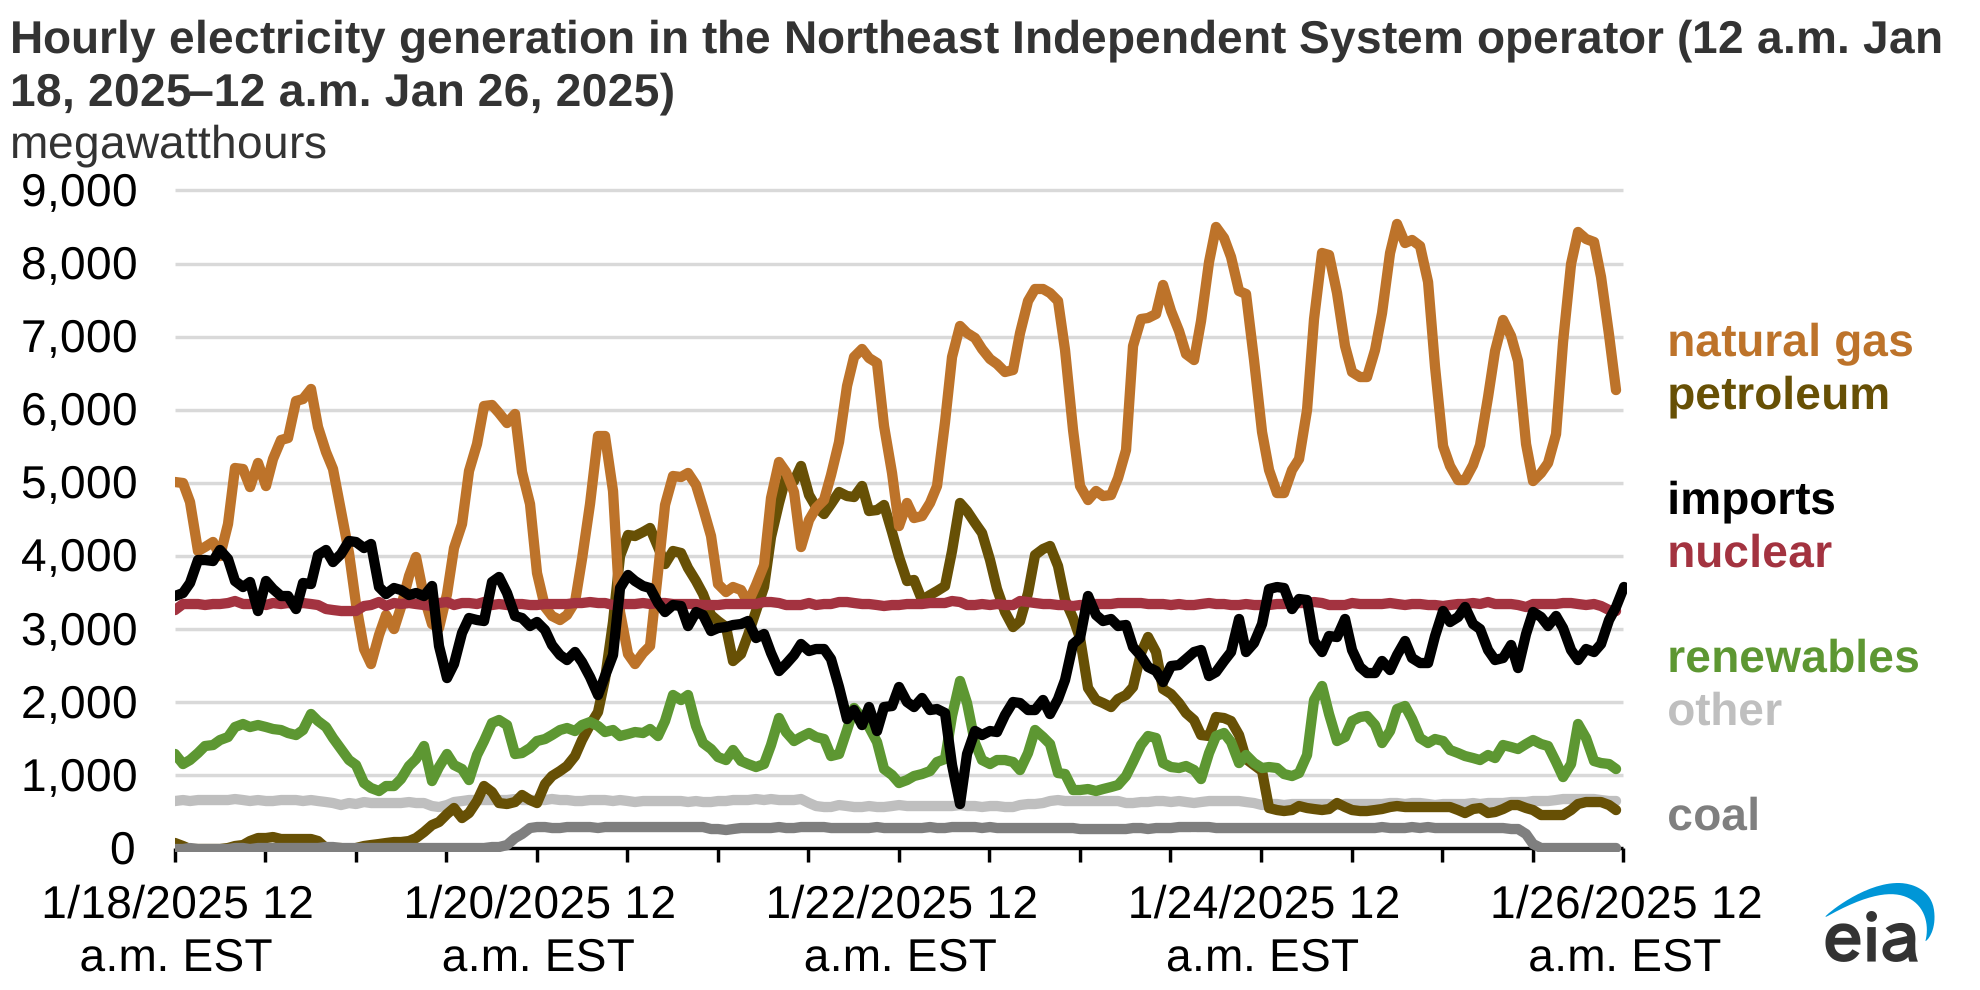
Below average temperatures in the eastern United States during the week of January 19, 2025, resulted in high demand for electricity. On January 21 at 6:00 p.m. eastern time, ISO-New England (ISO-NE), the organization operating an integrated grid in Maine, Vermont, New Hampshire, Massachusetts, Rhode Island, and Connecticut, recorded peak hourly demand of 19,600 megawatts (MW). Although demand was elevated, it was lower than the 20,308 MW that ISO-NE forecast peak demand would be in its 2024/2025 winter assessment published on November 7, 2024. Temperatures were more moderate in New England than in the Midwest, which tempered electricity demand somewhat in New England.
Although the grid had sufficient generating capacity to satisfy demand, a significant share of that supply came from sources that rarely operate. The grid required running older thermal generating plants that burn oil and coal. Between the hours of 11:00 a.m. and 4:00 p.m. eastern time on January 20, 2025, and between the hours of 10:00 a.m. and 1:00 p.m. on January 21, 2025, thermal plants that burn oil provided more electricity to the ISO-NE electricity grid than plants that burn natural gas, which is relatively uncommon. On January 21, 2025, the same group of thermal plants in ISO-NE provided more than 4,000 MW of electricity per hour to the grid between 7:00 a.m. and 11:00 p.m. At the same time, one of the two remaining coal-fired plants that burns coal in the region, the Merrimack facility in New Hampshire, supplied close to 300 MW to the grid from the evening of January 19 to the morning of January 25.
Oil and coal offset curtailed generation from natural gas-fired power plants from January 18 to January 22. Prices for natural gas were high, and supplies were short during this period because of more demand for natural gas from other consumers, such as homes and businesses. Later in the week, more natural gas was made available, including supply received from a liquefied natural gas (LNG) import terminal in Everett, Massachusetts. This supply helped boost generation from natural gas-fired power plants beginning on January 22.
Two other major sources of electricity in New England were steady suppliers during the cold snap. The region’s three nuclear reactors steadily provided 3,350 MW of power throughout the period, joined by consistent imports of power from Canada. At 11:00 p.m. on January 18, imports of electricity from Canada surpassed 4,200 MW and averaged 2,886 MW per hour between midnight on January 18 and midnight on January 26.
Principal contributors: Kimberly Peterson, Sue Smith