U.S. Energy Information Administration logo
Skip to sub-navigation
March 23, 2012

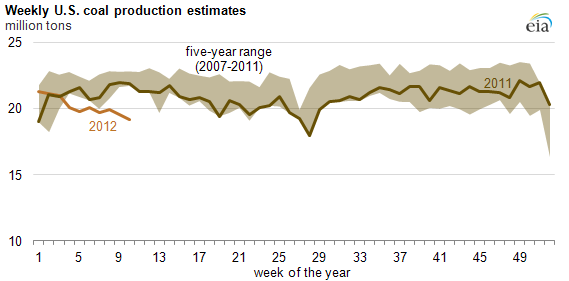
U.S. coal production in 2012 falls below five-year range
graph of Weekly U.S. coal production estimates, as described in the article text
Source: U.S. Energy Information Administration, Weekly Coal Production.
Note: Production data prior to September 2011 was provided by the MSHA, post-September 2011 data are preliminary EIA estimates.
Download CSV Data

Coal production the week ending March 10, 2012 was below the five-year range and 10% lower than the week ending March 12, 2011, according to weekly preliminary estimates from the U.S. Energy Information Administration and the latest quarterly production data from Mine Safety and Health Administration (MSHA). Warm weather this winter along with high stockpile levels and strong competition from natural gas depressed demand for coal by U.S. electric generators, which accounted for over 93% of total domestic coal use in the first nine months of 2011.

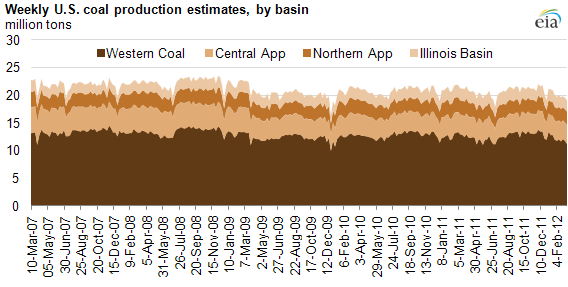
Production declines were most pronounced in Appalachian coal basins where some mine operators (including Consol Energy, Royal Coal Corporation, and Alpha Natural Resources) have chosen to idle mines in the face of weakened demand.

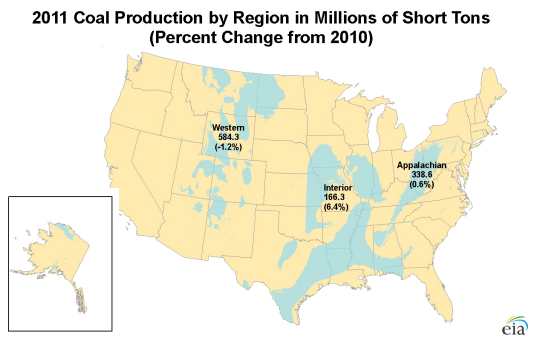
Coal production rose slightly in 2011, driven largely by exports of bituminous coal from the Appalachian and Interior regions to Asian markets. Flooding in early 2011 disrupted the coal mining industry in Australia, the world's largest coal exporter. Australian production, however, returned to near pre-flood levels during the second quarter of 2011, dampening demand for U.S. coal on the world market.
graph of Weekly U.S. coal production estimates, by basin, as described in the article text
Source: U.S. Energy Information Administration, Weekly Coal Production.
Notes: Central App and Northern App refer to the Central and Northern Appalachian basins. Illinois Basin is a major coal basin in the Interior region. Production data prior to September 2011 was provided by the MSHA, post-September 2011 data are preliminary EIA estimates.

Statistics
Analysis
Tools
Education
News

Petroleum & Other Liquids

Crude oil, gasoline, heating oil, diesel, propane, and other liquids including biofuels and natural gas liquids.

Natural Gas

Exploration and reserves, storage, imports and exports, production, prices, sales.

Electricity

Sales, revenue and prices, power plants, fuel use, stocks, generation, trade, demand & emissions.

Coal

Reserves, production, prices, employment and productivity, distribution, stocks, imports and exports.

Nuclear & Uranium

Uranium fuel, nuclear reactors, generation, spent fuel.

Renewable & Alternative Fuels

Includes hydropower, solar, wind, geothermal, biomass and ethanol.

EIA Survey Forms

Forms EIA uses to collect energy data including descriptions, links to survey instructions, and additional information.

Total Energy

Comprehensive data summaries, comparisons, analysis, and projections integrated across all energy sources.

U.S. States

State energy information, including overviews, rankings, data, and analyses.

International

International energy information, including overviews, rankings, data, and analyses.

Environment

Greenhouse gas data, voluntary reporting, electric power plant emissions.

Data Tools, Apps, & Maps

Tools to customize searches, view specific data sets, study detailed documentation, and access time-series data.

Open Data

EIA's free and open data available as API, Excel add-in, bulk files, and widgets

EIA Beta

Come test out some of the products still in development and let us know what you think!

Open Source Code

EIA's open source code, available on GitHub.

RSS Feeds

Subscribe to feeds for updates on EIA products including Today in Energy and What's New.