
Warm weather, low natural gas prices hold down wholesale power prices this winter
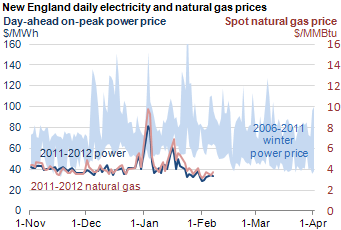
Average daily power prices in the Northeast and Midwest from the beginning of November 2011 through the first week of February have been unusually low. The driving factor is warm weather. Warm winter weather decreases the demand for electricity, which puts downward pressure on prices. The warm weather also cuts demand for natural gas, both as a heating fuel and as a fuel for power generation. This acts to hold down natural gas spot prices, which in turn decreases the cost of generating power.
Northeastern and Midwestern wholesale power prices typically are linked closely to natural gas prices, since natural gas-fired generators are often the marginal provider of power, and the marginal generator sets the power price in those markets. This connection is illustrated by the close tracking of the natural gas price (red line) and power price (blue line) in the chart above. This winter, warm weather and robust natural gas supplies moderated natural gas prices.
Cold weather around January 4 and January 16 contributed to higher spot natural gas and power prices in hubs in New York and New England. While the average January temperature at the LaGuardia Airport in New York City was 37°F, on January 4, the average daily temperature dipped to 19°F, and the average daily temperature was under 25°F on January 15 and 16.
During colder weather, demand for natural gas as a heating fuel increases, raising the spot market prices for natural gas, and therefore, for power as well. Northeastern price spikes are typically caused by natural gas pipeline capacity constraints on the natural gas grid serving this region and may not show up in other regions (see prices at Mid-Atlantic and Midwestern hubs below).
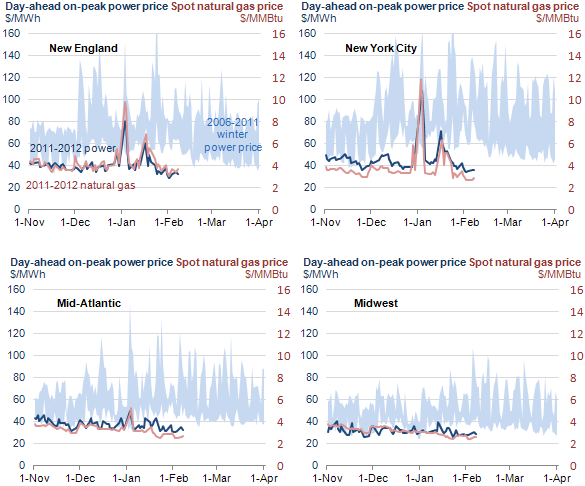
Note: Mid-Atlantic power prices are for the PJM-Western Hub, reflecting prices for PA, NJ, MD, DC, and VA.
Tags: consumption/demand, electricity, generation, Midwest, natural gas, New England, New York, prices, states, weather