
Asia became the main export destination for growing U.S. LNG exports in 2020
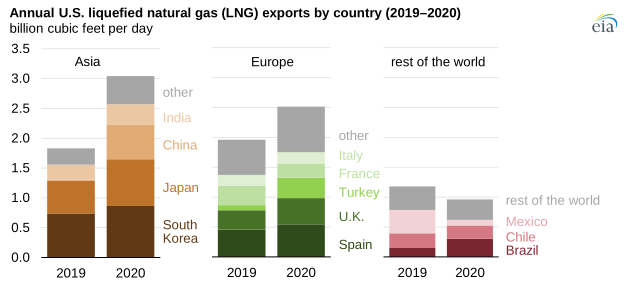
U.S. exports of liquefied natural gas (LNG) continued to grow in 2020, averaging 6.5 billion cubic feet per day (Bcf/d) on an annual basis, according to the U.S. Energy Information Administration’s Natural Gas Monthly. LNG exports increased 1.5 Bcf/d, or 31%, compared with 2019 levels. U.S. LNG exports were relatively high from January through May. In the summer months, they declined to record lows following record declines in international natural gas and LNG prices. By October, U.S. LNG exports started to increase again, despite brief interruptions caused by Hurricanes Laura and Delta. In November and December 2020, U.S. LNG exports reached all-time highs. U.S. LNG was exported to 38 countries, a record number, and Asia overtook Europe to become the main export destination in 2020.
LNG exports to Asia increased 67% in 2020 compared with 2019, accounting for almost half, or 3.1 Bcf/d, of all U.S. LNG exports. U.S. LNG exports to China averaged 0.6 Bcf/d in 2020—after China lowered tariffs on imports of LNG from the United States from 25% to 10%—the largest increase by country. In 2019, when tariffs were at 25%, only two U.S. LNG cargoes were shipped to China. India increased imports of U.S. LNG by an average of 0.1 Bcf/d, especially in the spring and summer when LNG prices were at record lows. U.S. LNG exports to Japan grew by 0.2 Bcf/d, primarily in the fourth quarter of 2020 because of seasonal winter demand.
U.S. LNG exports to Europe averaged 2.5 Bcf/d, an increase of 0.6 Bcf/d compared with 2019. Europe had been the main destination for U.S. LNG exports in 2019, accounting for 39% of U.S. LNG exports. In 2020, U.S. LNG exports to Turkey increased by 0.3 Bcf/d and to the United Kingdom, Spain, Greece, and Lithuania by 0.1 Bcf/d each.
U.S. LNG exports to several countries in Latin America (Colombia, Chile, Argentina, Mexico) and the Middle East (Jordan and the United Arab Emirates) declined by a combined 0.5 Bcf/d in 2020 compared with 2019. U.S. LNG exports to Mexico declined by 0.3 Bcf/d because of COVID-19 mitigation efforts that reduced demand for natural gas. Growing U.S. exports by pipeline to Mexico also displaced more expensive LNG imports. In contrast, Brazil more than doubled its U.S. LNG imports—an average annual increase of 0.2 Bcf/d—as a result of drought conditions that limited hydroelectric power generation and increased demand for natural gas-fired power generation.
Principal contributor: Victoria Zaretskaya