
EIA creates winter version of its daily energy dashboard for Southern California
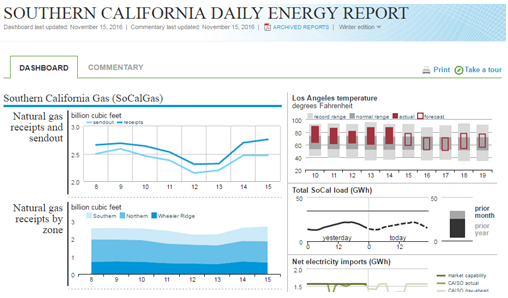
EIA has updated its Southern California Daily Energy Report to provide additional information on key energy market indicators for the winter season. The dashboard includes information that EIA regularly compiles about energy operations and the management of natural gas and electricity systems in Southern California in the aftermath of a leak at the Aliso Canyon natural gas storage facility outside of Los Angeles. Although the leak has since been plugged, regulators have placed ongoing limitations on the use of that facility.
In Southern California, natural gas demand is higher during winter months than in other seasons, reflecting the use of natural gas to heat residential and commercial buildings. EIA has updated several aspects of the dashboard to reflect the factors that affect the Southern California energy system during peak winter months.
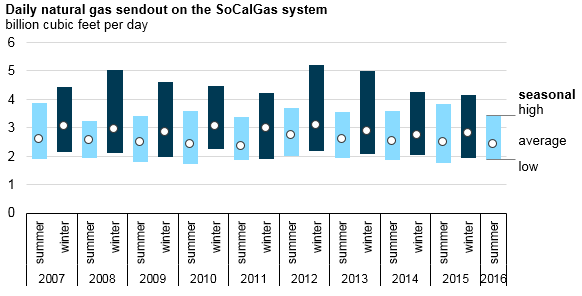
Note: Winter months include October through March, and summer months include April through September.
The commentary tab of the report reviews the elements of the dashboard and discusses their significance. Key elements added to the winter dashboard include:
Los Angeles temperatures, both recent and forecast, in the context of historical norms
For the winter, temperatures are a good measure of likely furnace load for space heating needs, and Los Angeles is the center of the metropolitan area. These daily ranges are compared with normal ranges and with record ranges.
Working gas storage level, in the context of year-ago level and five-year range
Lower storage levels relative to prior winters indicate how much less in-region stored natural gas is available to meet natural gas demand this winter.
Recent daily natural gas receipts and demand
These data show if daily nonstorage sources of natural gas are sufficient to meet demand. Net daily changes in storage inventories show how storage injections and withdrawals balance demand for natural gas with available supplies.
Deliveries of natural gas into the Southern California Gas Company (SoCalGas) system
Interstate natural gas pipelines and the Pacific Gas and Electric (PG&E) system deliver natural gas into the SoCalGas system. With less natural gas available from storage, deliveries to SoCalGas are likely to be more important this winter than in past winters.
Spot natural gas price differences to the Southern California Border price
Changes in spot natural gas prices can indicate constraints or disruptions in the natural gas system. Higher-than-normal price differences between downstream (demand) market points, like the PG&E Citygate or the SoCal Citygate, and upstream (supply) market points, like in Western Wyoming, the San Juan Basin, or West Texas and Southern California border, can indicate conditions including wellhead freeze-offs, high market demand, cold weather in the Southwest, high use of pipeline networks, or unplanned outages on pipelines.
Electricity imports from the Pacific Northwest into Southern California
To have natural gas available to meet residential and commercial customer needs on the coldest days, electric utilities and grid managers may rely on electricity imports to a greater extent than when Aliso Canyon was fully operational and SoCalGas had much higher levels of stored gas available. New information illustrates hourly electricity flows transmitted by the Bonneville Power Administration to the California Independent System Operator (CAISO) in Southern California along the Pacific DC Intertie.
Spot hourly electricity prices
EIA reports SP15 locational marginal prices (LMPs) by hour. Using hourly LMPs instead of daily, on-peak, average LMPs makes it easier to assess how changes in hourly loads and hourly electricity imports align with changes in hourly prices.
Regional map with key natural gas pipeline and storage infrastructure in Southern California
The revised map now includes a daily total of natural gas receipts from interstate and intrastate natural gas pipelines by major zones in the SoCalGas system.
The winter edition of the report still provides the information on spot natural gas prices and regional hourly electric power loads that was included in the summer version, which remains available on the dashboard. The dashboard is updated at about 7:00 a.m. Pacific Time every morning.
Principal contributor: Chris Peterson
Tags: California, electricity, generation, natural gas, pipelines, states, storage