
Recent increases in global nuclear capacity led by Asia
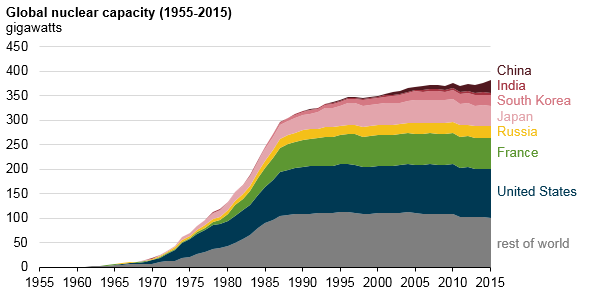
Global nuclear capacity reached 383 gigawatts (GW) in 2015, driven primarily by nuclear additions in Asia. Currently, 31 countries have nuclear power programs, totaling 441 operating reactors. An additional 60 reactors are under construction in 15 countries, adding 59 GW of electricity generating capacity over the next decade. Plans to add another 90 reactors (76 GW) have been formally transmitted to the International Atomic Energy Agency (IAEA) by 8 countries.
Following the development of the first nuclear reactors in the 1950s, nuclear power steadily grew around the world from the early 1970s to the early 1990s, with brief periods of relatively slow growth following the accidents at Three Mile Island (1979) and Chernobyl (1986). Since then, nuclear power capacity has remained relatively stable throughout most of the world, with the exception of Asia.
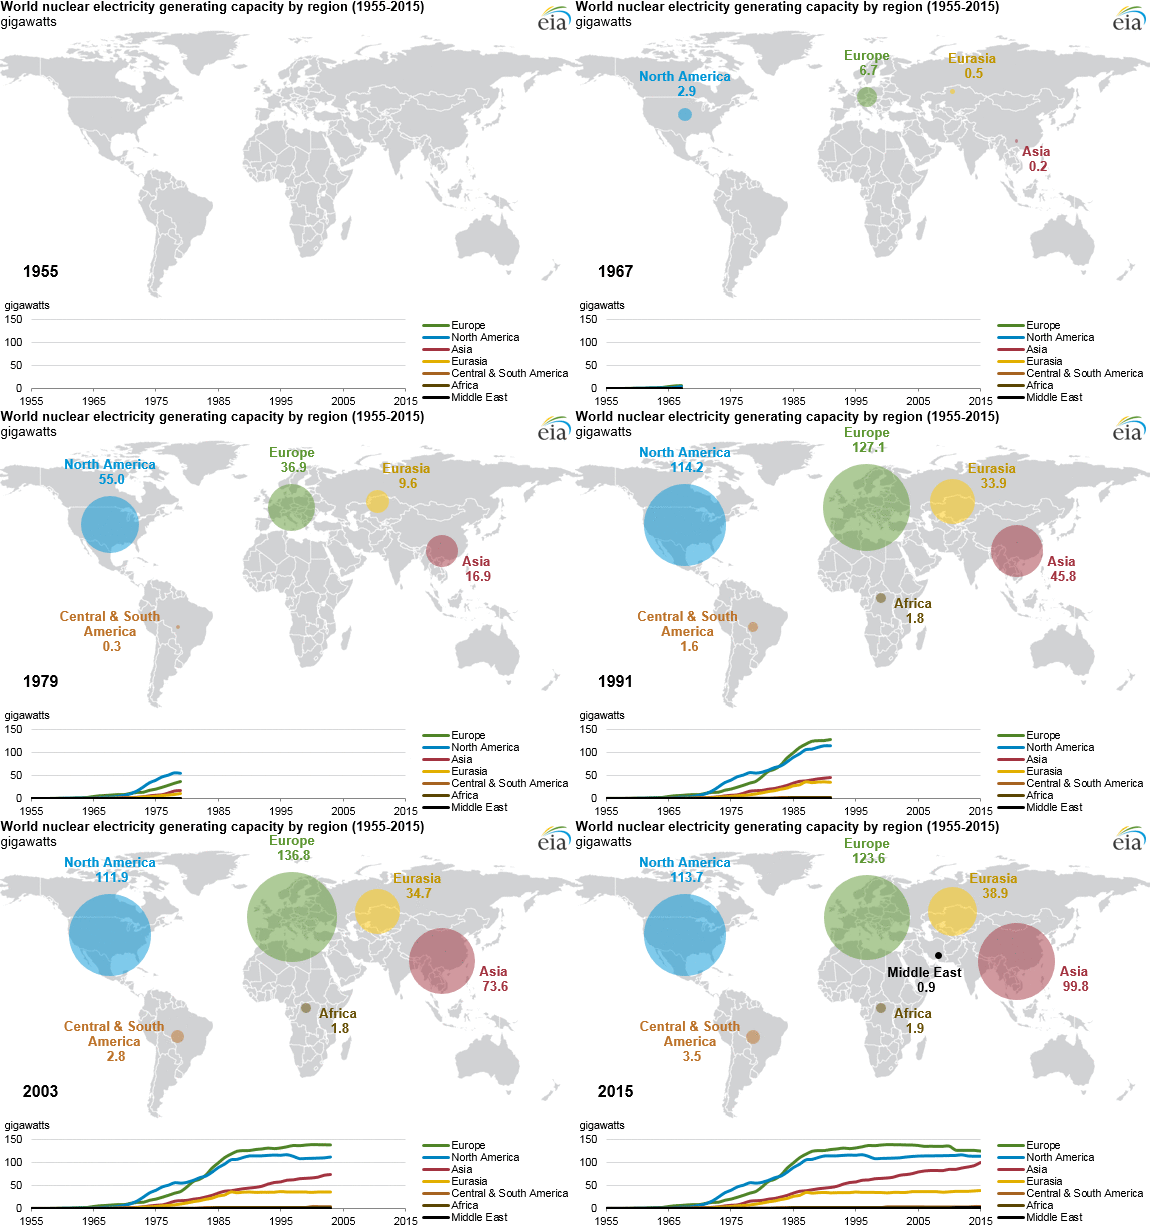
North America. The United States and Canada began building nuclear power plants in the 1950s and 1960s, respectively. Nuclear capacity developed most quickly between 1970 and 1995. Since 2013, retirements in the United States have not been offset by new additions, and capacity has declined. Five reactors have retired since 2014 for economic reasons, and eight more have announced plans to retire starting in late 2016 and continuing through 2025. In contrast, just one new reactor will have come online since 1996, as Watts Bar Unit 2 is scheduled to begin commercial operation later this year. Four other reactors are currently under construction and are expected to come online between 2019 and 2020.
Europe. France, Belgium, Germany, Sweden, Italy, and the United Kingdom commissioned nuclear power plants in the 1960s. European nuclear capacity was relatively stable until 2011, when Germany announced that it was phasing out nuclear energy following the Fukushima accident in Japan. Germany immediately shut down eight reactors, nearly half of its fleet. Retirements in the United Kingdom have also contributed to a decline in nuclear capacity in Europe.
Eurasia. Russia and Ukraine account for almost all of Eurasia's nuclear capacity. Russia is building 22 new nuclear power plants (totaling 27 GW), which should be online between 2016 and 2020, and the country has formally told the IAEA that it intends to build 7 more plants (totaling 5.5 GW).
Asia. Between 1980 and 2010, nuclear capacity in Asia quadrupled, led primarily by South Korea, Japan, and India. Prior to the accident at Fukushima, Japan had 54 operating reactors totaling 46.8 GW; only 5 reactors have been approved for restart. More recently, growth in nuclear capacity in Asia has been led primarily by China, where capacity has nearly quadrupled in the past 10 years. Nuclear additions in China have accounted for 18 GW of the 22 GW added globally between 2009 and 2015. Of the 61 reactors currently under construction worldwide, 20 are in China, and China has formally told the IAEA that it plans to build another 20 reactors.
Middle East. In Iran, Bushehr Unit 1 (0.9 GW) began commercial operations in 2013. Iran has formally told the IAEA that it intends to add three more reactors (totaling 2.1 GW), but no operational dates have been announced. In the United Arab Emirates, four reactors (totaling 5.6 GW) are under construction and are expected to be online between 2017 and 2020.
Principal contributor: Nancy Slater-Thompson
Tags: China, electricity, Europe, generating capacity, India, international, map, nuclear, Russia