
U.S. natural gas production reaches record high in 2015
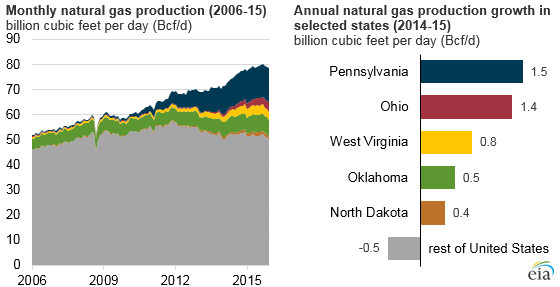
U.S. natural gas production reached a record high level of 79 billion cubic feet per day (Bcf/d) in 2015, an increase of 5% from the previous year, even as natural gas prices remained relatively low. Production from five states—Pennsylvania, Ohio, West Virginia, Oklahoma, and North Dakota—was responsible for most of this growth, offsetting declines in much of the rest of the United States.
EIA uses three different concepts to measure natural gas production. Gross withdrawals are the full volume of compounds extracted at the wellhead, which includes all natural gas plant liquids and nonhydrocarbon gases after oil, lease condensate, and water have been removed. Marketed natural gas production, which is used in this analysis, excludes natural gas used for repressuring the well, vented and flared gas, and any nonhydrocarbon gases. Dry natural gas production equals marketed production minus natural gas plant liquids.
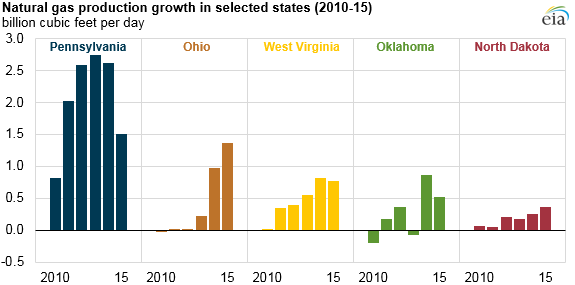
Natural gas production from Pennsylvania, Ohio, West Virginia, Oklahoma, and North Dakota accounted for 35% of total U.S. natural gas production in 2015. In most cases, production in these states continued to increase in 2015, but at a slower pace than in the previous year. For instance, in Pennsylvania, the second-highest producing state, year-over-year natural gas production growth fell from 2.6 Bcf/d in 2014 to 1.5 Bcf/d in 2015.
In contrast, natural gas production growth continued to increase in Ohio, with production increasing by 1.4 Bcf/d in 2015, 41% higher than production growth in 2014. Most of the increase in Ohio's natural gas production is from the relatively less-developed Utica Shale play. Production from the Utica Shale will likely grow in the future.
Total natural gas production in the federal Gulf of Mexico grew slightly (6%), reaching 3.6 Bcf/d in 2015, after declining for five consecutive years. The long-term decline in natural gas production from the Gulf of Mexico is likely the result of the higher cost of offshore production compared with onshore production. Historically, most Gulf of Mexico natural gas production has come from shallow water fields.
Natural gas production in Louisiana fell 2% to 5.3 Bcf/d from 2014 to 2015. Between 2012 and 2015, natural gas production from the Haynesville Shale play decreased by 45%, contributing to the drop in Louisiana's natural gas production. Natural gas production from other states remained relatively flat, and total production from shale plays around the country more than offset the longer-term declines in the Gulf of Mexico and Louisiana.
EIA's Short-Term Energy Outlook projects natural gas production growth will slow to 0.9% in 2016, as low natural gas prices and declining rig activity temporarily reduce production. In 2017, however, forecast production growth increases to 2.2%, as projected natural gas prices rise, industrial demand grows, and liquefied natural gas (LNG) exports increase.
Principal contributors: Jeffrey Little, Tu Tran