
Crude oil storage and capacity have increased in Cushing, Oklahoma and U.S. Gulf Coast
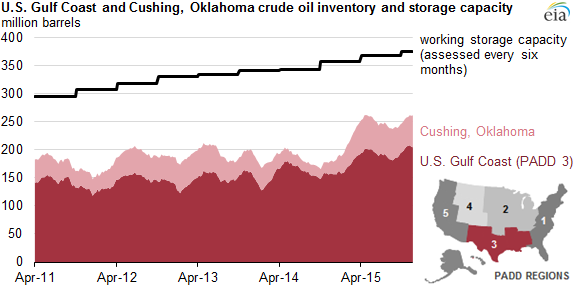
Note: Adjusted inventory equals commercial crude oil inventories less line fill (oil held in pipelines).
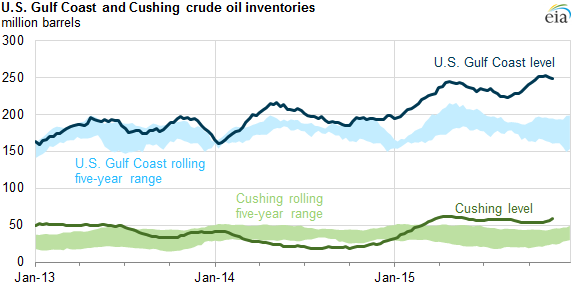
Commercial crude oil inventories in Cushing, Oklahoma (located in Petroleum Administration for Defense District 2) and the U.S. Gulf Coast (PADD 3) totaled a record-high 309.4 million barrels as of the week ending November 27. Based on the recently released storage capacity and line fill data in the September Petroleum Supply Monthly (PSM), EIA estimates 70.2% utilization of working crude oil storage capacity in Cushing and the Gulf Coast on a combined basis, only slightly below the record utilization level of 71.2% set in the week ending April 24 of this year.
The U.S. Gulf Coast region contains 55% of the nation's crude oil storage capacity, and Cushing contains another 13%. As of the week ending November 27, these two locations contained 67% of the nation's crude oil inventories. They are also home to most of the growth in crude oil storage capacity over the past four and a half years. Since March 2011, the Gulf Coast and Cushing have accounted for about 85% of the nation's increase in crude oil storage capacity, growing by 55.7 million barrels and 25.0 million barrels, respectively.
Although storage utilization levels along the Gulf Coast and at Cushing are often assessed separately, their combined utilization is currently most relevant given the increased pipeline capacity to move crude oil south from Cushing to the Gulf Coast during a time of high global crude oil inventory builds. Despite relatively high crude oil inventories and storage capacity utilization, there are still more than 100 million barrels of capacity available in these two areas. More information about the interplay between crude oil storage patterns and financial markets is available in This Week in Petroleum.
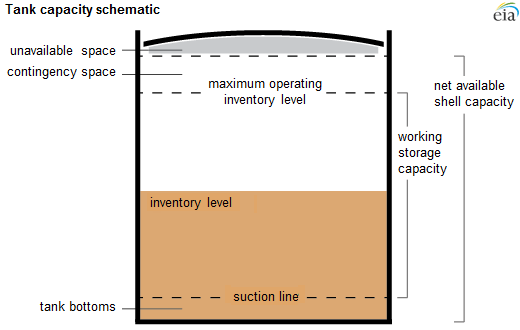
EIA has published net available shell and working crude oil storage capacity data in the March and September PSM releases since September 2010. However, until recently, calculating an effective utilization rate for this capacity was difficult. Simply dividing EIA's total commercial inventories by working capacity overestimated utilization because the inventory data include some crude oil not stored in tanks, such as that held in pipelines (pipeline fill). As of the March 2015 release, EIA now publishes more granular data indicating estimated pipeline fill, improving the utilization calculation. Total working capacity is often the best measure of total available storage since it excludes tank bottoms and contingency space.
Principal contributors: Colin Shaughnessy-Salazar, Hannah Breul