U.S. Energy Information Administration logo
Skip to sub-navigation
July 22, 2011

Wholesale electricity prices in New York City are the highest in the contiguous U.S.
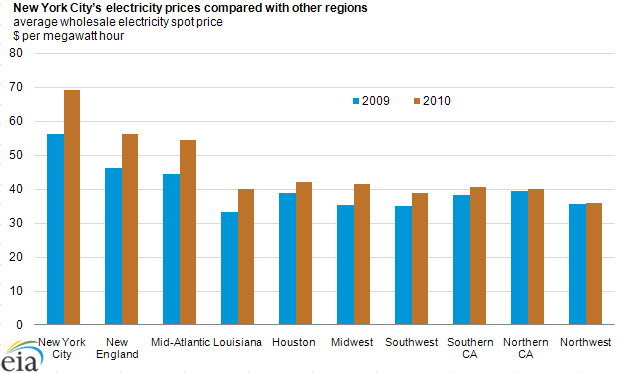
graph of New York's City electricity prices compared with other regions, as described in the article text
Source: U.S. Energy Information Administration based on SNL Energy, average day-ahead, on-peak spot prices
Download CSV Data

Wholesale, on-peak electricity prices in New York City are the highest in the contiguous United States. In 2010, the average day-ahead, on-peak spot price of electricity in New York City was $65 per megawatt hour, higher than in neighboring New England and Mid-Atlantic regions. There are three main reasons for higher prices in New York City: high-cost, in-city generation; often insufficient in-city generation to meet demand; and limited transmission capacity leading into the city.

New York City imported approximately two-thirds of its power from outside the city limits in 2010. While the city has generating capacity equal to 80% of its annual peak load, many of these units are operated infrequently because it is usually less expensive to buy power produced outside the city. Transmission lines leading into the city are often congested when the amount of cheaper imported power reaches the limit of the transmission lines. Transmission congestion can also occur during thunderstorm alerts, where transmission capacity is curtailed into the city for reliability reasons.

Since the cost of transmission congestion is reflected in wholesale prices in the New York Independent System Operator, or NYISO market, wholesale prices in New York City rise above those upstate. When demand for electricity grows in the city, the wholesale price goes up as more expensive units located in the city are dispatched to meet demand. The increased cost of generating electricity in the city is often driven by high natural gas prices resulting from pipeline congestion leading into the city.

New York City is the only place in the country where generator price bids into RTO markets are routinely mitigated (bid replaced by a cost-based value calculated by the NYISO staff) to avoid the potential exercise of market power.

Statistics
Analysis
Tools
Education
News

Petroleum & Other Liquids

Crude oil, gasoline, heating oil, diesel, propane, and other liquids including biofuels and natural gas liquids.

Natural Gas

Exploration and reserves, storage, imports and exports, production, prices, sales.

Electricity

Sales, revenue and prices, power plants, fuel use, stocks, generation, trade, demand & emissions.

Coal

Reserves, production, prices, employment and productivity, distribution, stocks, imports and exports.

Nuclear & Uranium

Uranium fuel, nuclear reactors, generation, spent fuel.

Renewable & Alternative Fuels

Includes hydropower, solar, wind, geothermal, biomass and ethanol.

EIA Survey Forms

Forms EIA uses to collect energy data including descriptions, links to survey instructions, and additional information.

Total Energy

Comprehensive data summaries, comparisons, analysis, and projections integrated across all energy sources.

U.S. States

State energy information, including overviews, rankings, data, and analyses.

International

International energy information, including overviews, rankings, data, and analyses.

Environment

Greenhouse gas data, voluntary reporting, electric power plant emissions.

Data Tools, Apps, & Maps

Tools to customize searches, view specific data sets, study detailed documentation, and access time-series data.

Open Data

EIA's free and open data available as API, Excel add-in, bulk files, and widgets

EIA Beta

Come test out some of the products still in development and let us know what you think!

Open Source Code

EIA's open source code, available on GitHub.

RSS Feeds

Subscribe to feeds for updates on EIA products including Today in Energy and What's New.