U.S. Energy Information Administration logo
Skip to sub-navigation
January 6, 2015

Crude oil prices down sharply in fourth quarter of 2014

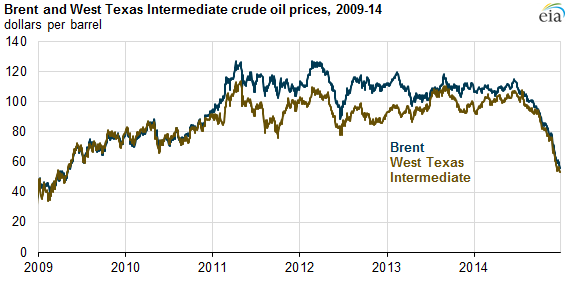
graph of Brent and WTI crude oil prices, as explained in the article text
Source: U.S. Energy Information Administration, based on Bloomberg

Crude oil prices fell sharply in the fourth quarter of 2014 as robust global production exceeded demand. After reaching monthly peaks of $112 per barrel (bbl) and $105/bbl in June, crude oil benchmarks Brent and West Texas Intermediate (WTI) fell to $62/bbl and $59/bbl in December, respectively.

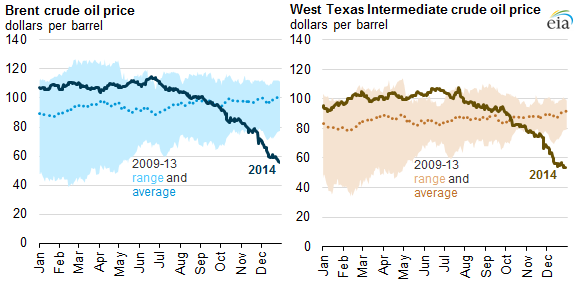
Brent prices fell below the five-year average in early September and slipped well below the five-year range in November and December. WTI prices have been below the five-year average since early October and below the five year-range since early November.

graph of Brent and WTI crude oil prices, as explained in the article text
Source: U.S. Energy Information Administration, based on Bloomberg

U.S. highlights

  • Domestic crude oil production increased 1.2 million barrels per day (bbl/d) in 2014, up 16% from 2013. At 8.6 million bbl/d, U.S. production is at the highest level in nearly 30 years.
  • The Brent-WTI spread averaged less than $6/bbl, significantly lower than the 2011-13 average of nearly $15/bbl.

Global highlights

  • Estimated global liquids production grew by 1.8 million bbl/d to total 92.0 million bbl/d in 2014, mainly reflecting non-OPEC (Organization of the Petroleum Exporting Countries) production increases concentrated in North America.
  • EIA estimates that global unplanned supply disruptions averaged 3.1 million bbl/d in 2014, 0.4 million bbl/d higher than the previous year. OPEC producers had the largest share of outages at 2.5 million bbl/d.
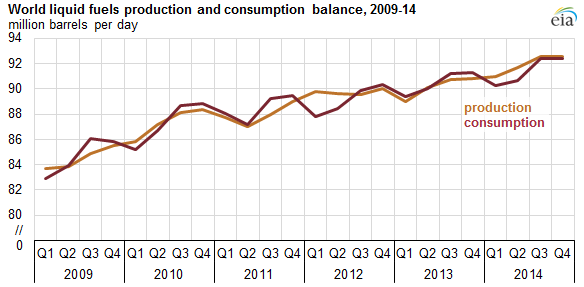
  • EIA estimates that global liquid fuels production exceeded consumption in each of the four quarters of 2014. In the previous five years, production had not exceeded consumption for more than two consecutive quarters.
graph of world liquid fuels production and consumption balance, as explained in the article text
Source: U.S. Energy Information Administration, Short-Term Energy Outlook, December 2014
Note: Fourth-quarter 2014 represents a forecast.

Principal contributor: Hannah Breul

Statistics
Analysis
Tools
Education
News

Petroleum & Other Liquids

Crude oil, gasoline, heating oil, diesel, propane, and other liquids including biofuels and natural gas liquids.

Natural Gas

Exploration and reserves, storage, imports and exports, production, prices, sales.

Electricity

Sales, revenue and prices, power plants, fuel use, stocks, generation, trade, demand & emissions.

Coal

Reserves, production, prices, employment and productivity, distribution, stocks, imports and exports.

Nuclear & Uranium

Uranium fuel, nuclear reactors, generation, spent fuel.

Renewable & Alternative Fuels

Includes hydropower, solar, wind, geothermal, biomass and ethanol.

EIA Survey Forms

Forms EIA uses to collect energy data including descriptions, links to survey instructions, and additional information.

Total Energy

Comprehensive data summaries, comparisons, analysis, and projections integrated across all energy sources.

U.S. States

State energy information, including overviews, rankings, data, and analyses.

International

International energy information, including overviews, rankings, data, and analyses.

Environment

Greenhouse gas data, voluntary reporting, electric power plant emissions.

Data Tools, Apps, & Maps

Tools to customize searches, view specific data sets, study detailed documentation, and access time-series data.

Open Data

EIA's free and open data available as API, Excel add-in, bulk files, and widgets

EIA Beta

Come test out some of the products still in development and let us know what you think!

Open Source Code

EIA's open source code, available on GitHub.

RSS Feeds

Subscribe to feeds for updates on EIA products including Today in Energy and What's New.