
Europe and Asia are the leading destinations for U.S. coal exports in 2012
Note: For top seven ports totaling 94% of U.S. exports. Due to limited volumes, South and Central America are combined.
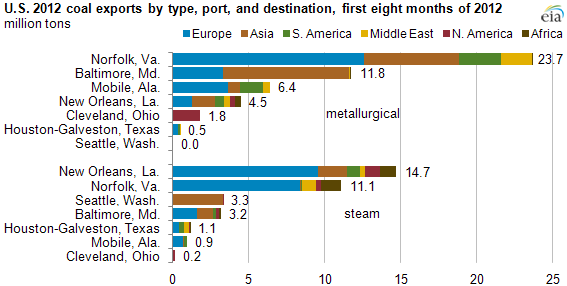
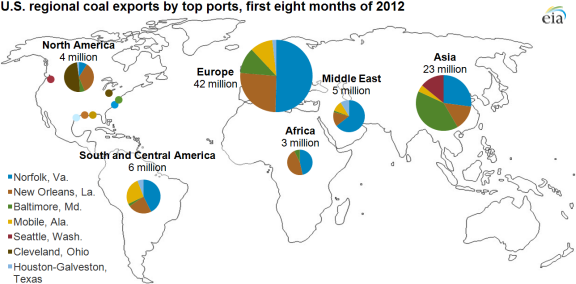
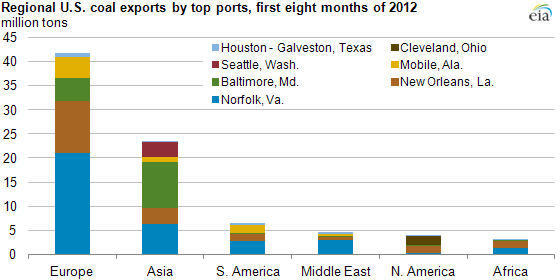
About 75% of U.S. coal exports were shipped to Europe and Asia in 2012, continuing the growth of the past few years with exports this year expected to reach an all-time high. Despite growing demand in Asia, the United States exports slightly more coal to Europe than it sends the rest of the world combined. U.S. coal exports to Europe are primarily serviced out of the East Coast via Norfolk, Virginia (the largest coal export facility in the United States) and Baltimore, Maryland (the third largest). Exports to Asia originate mostly from the East Coast as well, primarily out of Baltimore. Somewhat counterintuitively, most coal out of Baltimore—almost double the port's European volume—is destined for Asia, the world's largest coal consuming region.
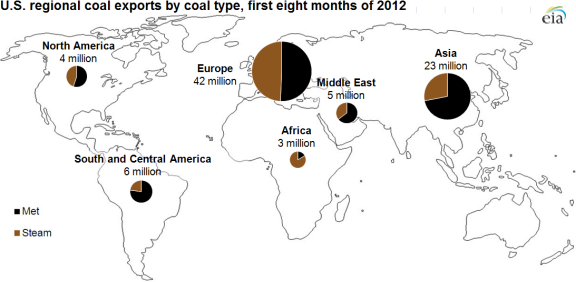
One reason eastern seaports are the primary origin of U.S. coal exports to Asia is their proximity to U.S. metallurgical (met) coal mines, concentrated in the eastern United States. While U.S. exports to Europe are closely split between met and steam coal (used to generate electricity), Asia primarily imports met coal, which is used in steelmaking. The unavailability of significant capacity limits exports from the western United States, the country's largest coal producing region, although the Seattle customs district has seen rapid growth over the past several years exporting steam coal via rail to Canada, where it is then shipped to Asia.
U.S. Coal Exports
Note: For top seven ports totaling 94% of U.S. exports. Data for 2012 run through August. Due to limited volumes, South and Central America are combined and Oceania is not displayed.
Note: For top seven ports totaling 94% of U.S. exports. Data for 2012 run through August. Due to limited volumes, South and Central America are combined and Oceania is not displayed.
Note: For top seven ports totaling 94% of U.S. exports. Data for 2012 run through August. Due to limited volumes, South and Central America are combined.
U.S. coal exports are largely concentrated in a few facilities, with the leading seven ports accounting for 94% of U.S. exports. Norfolk, the largest coal port, shipped almost 35 million tons of coal from January through August 2012 (the latest trade data available), accounting for nearly 40% of total U.S. exports. With access to barge shipments down the Mississippi River, exports out of New Orleans have grown from around one million tons in 2000 to more than 19 million tons in the first eight months of 2012, making it the second highest volume coal port in the United States. Among the top export facilities, only New Orleans and Seattle primarily export steam coal. While the majority of U.S. exports are met coal, growing steam coal demand is fueling 2012 exports to an expected all-time high. High natural gas prices in Europe have contributed to increased imports of U.S. steam coal.
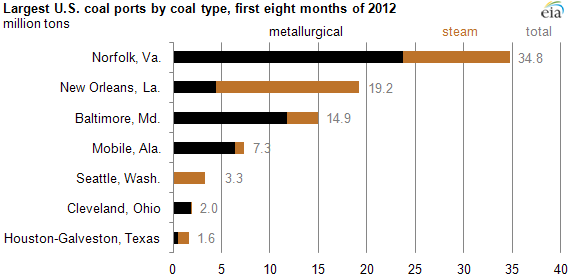
Note: Top seven ports account for 94% of total U.S. coal exports for the period.
Tags: coal, Europe, exports/imports, international, Louisiana, map, Ohio, states, Texas, Washington