U.S. Energy Information Administration logo
Skip to sub-navigation
August 14, 2012

U.S. total motor gasoline exports down slightly from last year but still at high levels
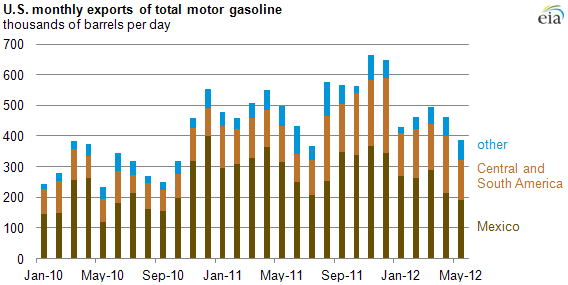
graph of U.S. monthly exports of total motor gasoline, as described in the article text
Source: U.S. Energy Information Administration, Petroleum Navigator.
Note: Total motor gasoline = finished motor gasoline + motor gasoline blending components.

In November 2010, U.S. exports of total motor gasoline exceeded 400 thousand barrels per day (bbl/d) for the first month since 1945 and have mostly remained above that level through May of this year. Exports from January through May 2012, which averaged about 446 thousand bbl/d, were down about 53 thousand bbl/d compared with the same period last year but were still near historically high levels. Most of the exports went to Mexico and countries in Central and South America.

After declining slightly from 2005 to 2007, total monthly U.S. motor gasoline exports increased from 2007 to 2011, reaching an annual average record of 526 thousand bbl/d last year. Average daily exports of total motor gasoline rose 380 thousand bbl/d between 2007 and 2011, with exports to Mexico accounting for 57% of the overall growth in total motor gasoline exports.

Falling domestic motor gasoline consumption has created opportunities for higher exports. The Gulf Coast accounts for most U.S. motor gasoline and distillate exports because of higher production levels, access to ports, and proximity to export markets. Lower domestic demand and excess regional refinery capacity have supported growth in U.S. gasoline and distillate exports.
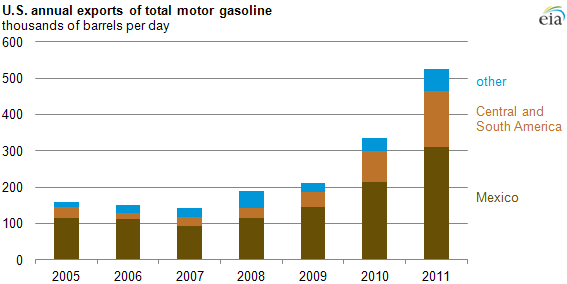
graph of U.S. annual exports of total motor gasoline, as described in the article text
Source: U.S. Energy Information Administration, Petroleum Navigator.
Note: Total motor gasoline = finished motor gasoline + motor gasoline blending components.

Statistics
Analysis
Tools
Education
News

Petroleum & Other Liquids

Crude oil, gasoline, heating oil, diesel, propane, and other liquids including biofuels and natural gas liquids.

Natural Gas

Exploration and reserves, storage, imports and exports, production, prices, sales.

Electricity

Sales, revenue and prices, power plants, fuel use, stocks, generation, trade, demand & emissions.

Coal

Reserves, production, prices, employment and productivity, distribution, stocks, imports and exports.

Nuclear & Uranium

Uranium fuel, nuclear reactors, generation, spent fuel.

Renewable & Alternative Fuels

Includes hydropower, solar, wind, geothermal, biomass and ethanol.

EIA Survey Forms

Forms EIA uses to collect energy data including descriptions, links to survey instructions, and additional information.

Total Energy

Comprehensive data summaries, comparisons, analysis, and projections integrated across all energy sources.

U.S. States

State energy information, including overviews, rankings, data, and analyses.

International

International energy information, including overviews, rankings, data, and analyses.

Environment

Greenhouse gas data, voluntary reporting, electric power plant emissions.

Data Tools, Apps, & Maps

Tools to customize searches, view specific data sets, study detailed documentation, and access time-series data.

Open Data

EIA's free and open data available as API, Excel add-in, bulk files, and widgets

EIA Beta

Come test out some of the products still in development and let us know what you think!

Open Source Code

EIA's open source code, available on GitHub.

RSS Feeds

Subscribe to feeds for updates on EIA products including Today in Energy and What's New.