
Crude oils have different quality characteristics
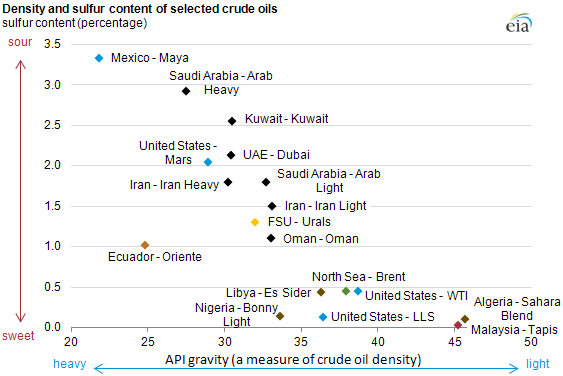
Notes: Points on the graph are labeled by country and benchmark name and are color coded to correspond with regions in the map below. The graph does not indicate price or volume output values. United States-Mars is an offshore drilling site in the Gulf of Mexico. WTI = West Texas Intermediate; LLS = Louisiana Light Sweet; FSU = Former Soviet Union; UAE = United Arab Emirates.
Republished: June 26, 2013: Map was corrected.
Many types of crude oil are produced around the world. The market value of an individual crude stream reflects its quality characteristics. Two of the most important quality characteristics are density and sulfur content. Density ranges from light to heavy, while sulfur content is characterized as sweet or sour. The crude oils represented in the chart are a selection of some of the crude oils marketed in various parts of the world. There are some crude oils both below and above the API gravity range shown in the chart.
Crude oils that are light (higher degrees of API gravity, or lower density) and sweet (low sulfur content) are usually priced higher than heavy, sour crude oils. This is partly because gasoline and diesel fuel, which typically sell at a significant premium to residual fuel oil and other "bottom of the barrel" products, can usually be more easily and cheaply produced using light, sweet crude oil. The light sweet grades are desirable because they can be processed with far less sophisticated and energy-intensive processes/refineries. The figure shows select crude types from around the world with their corresponding sulfur content and density characteristics.
The selected crude oils in the figure are not intended to be comprehensive of global crude production. Rather, they were grades selected for the recurrent and recently updated EIA report, "The Availability and Price of Petroleum and Petroleum Products Produced in Countries Other Than Iran."
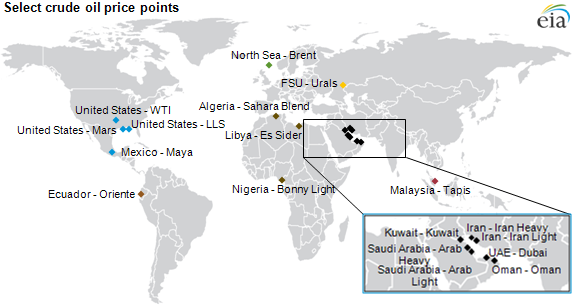
Notes: Locations on the map are based on the pricing point, not necessarily the area of production. Locations are approximate. Points on the map are labeled by country and benchmark name. United States-Mars is an offshore drilling site in the Gulf of Mexico. WTI = West Texas Intermediate; LLS = Louisiana Light Sweet; FSU = Former Soviet Union; UAE = United Arab Emirates.