
EIA extends five key energy forecasts through December 2026
In our January 2024 Short-Term Energy Outlook, which includes data and forecasts through December 2026, we forecast five key energy trends that we expect will help shape markets over the next two years.
Electricity consumption will start growing, driven by new demand sources
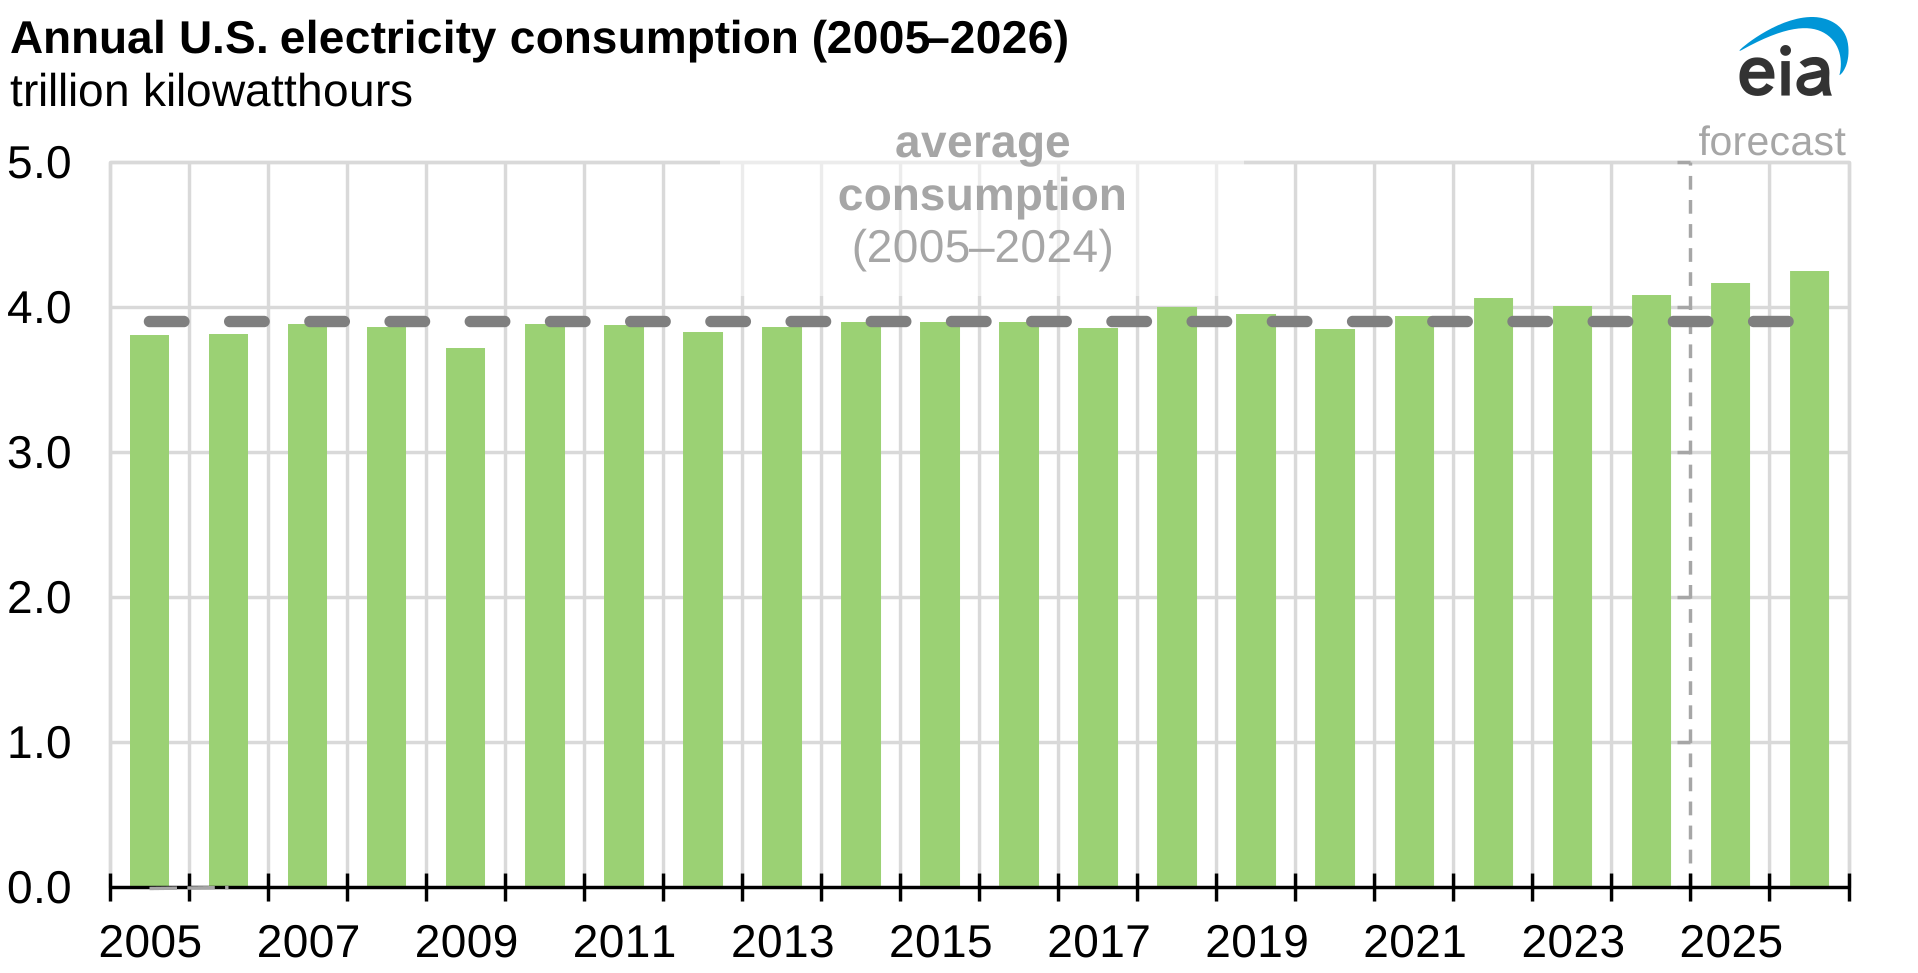
After almost two decades of relatively little change, electricity consumption grew by 2% in 2024, and we forecast it will continue growing by 2% in both 2025 and 2026, mostly as a result of demand from new semiconductor and battery manufacturing factories and from data centers.
Solar power will supply most of the increase in electricity consumption
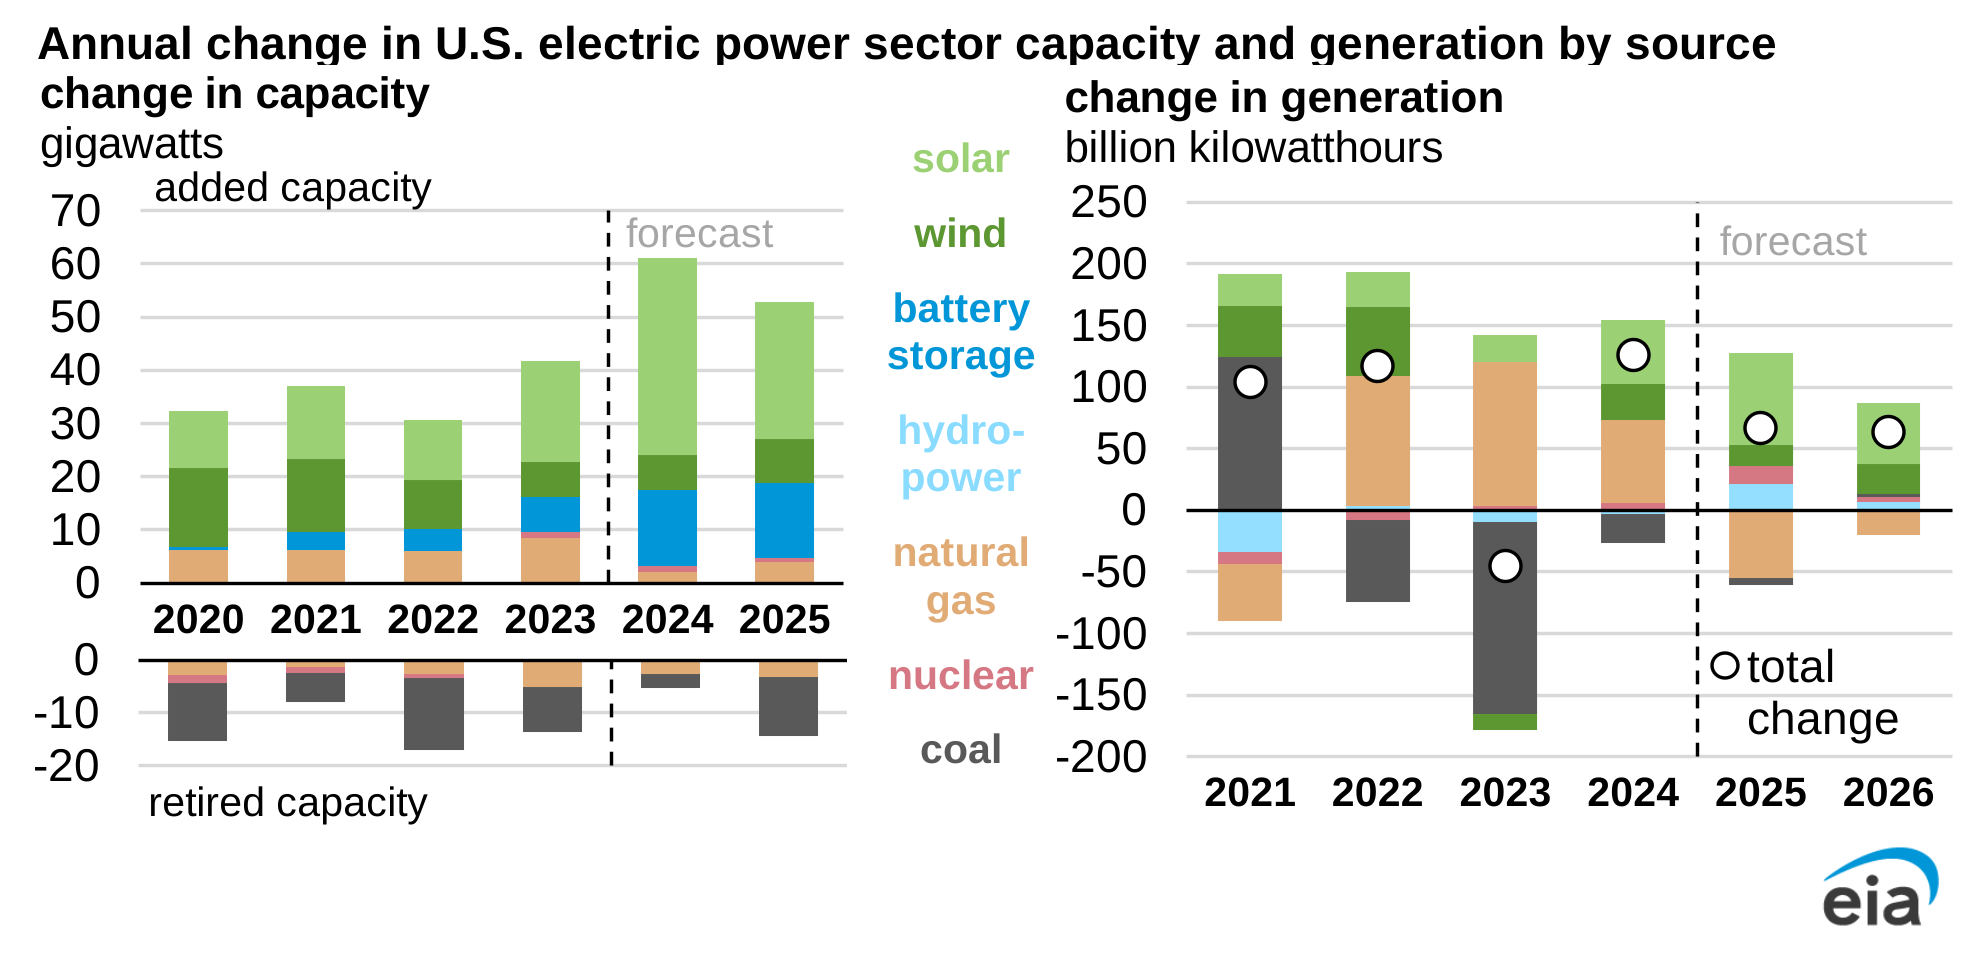
Note: Battery storage net generation is close to zero, reflecting the net effect of charging and discharging.
Solar power supplies most of the increase in generation in our forecast. We expect the electric power sector to add 26 gigawatts (GW) of new solar capacity in 2025 and 22 GW in 2026. We expect these capacity additions will increase U.S. solar generation by 34% in 2025 and by 17% in 2026.
Global oil consumption growth remains below its pre-pandemic average
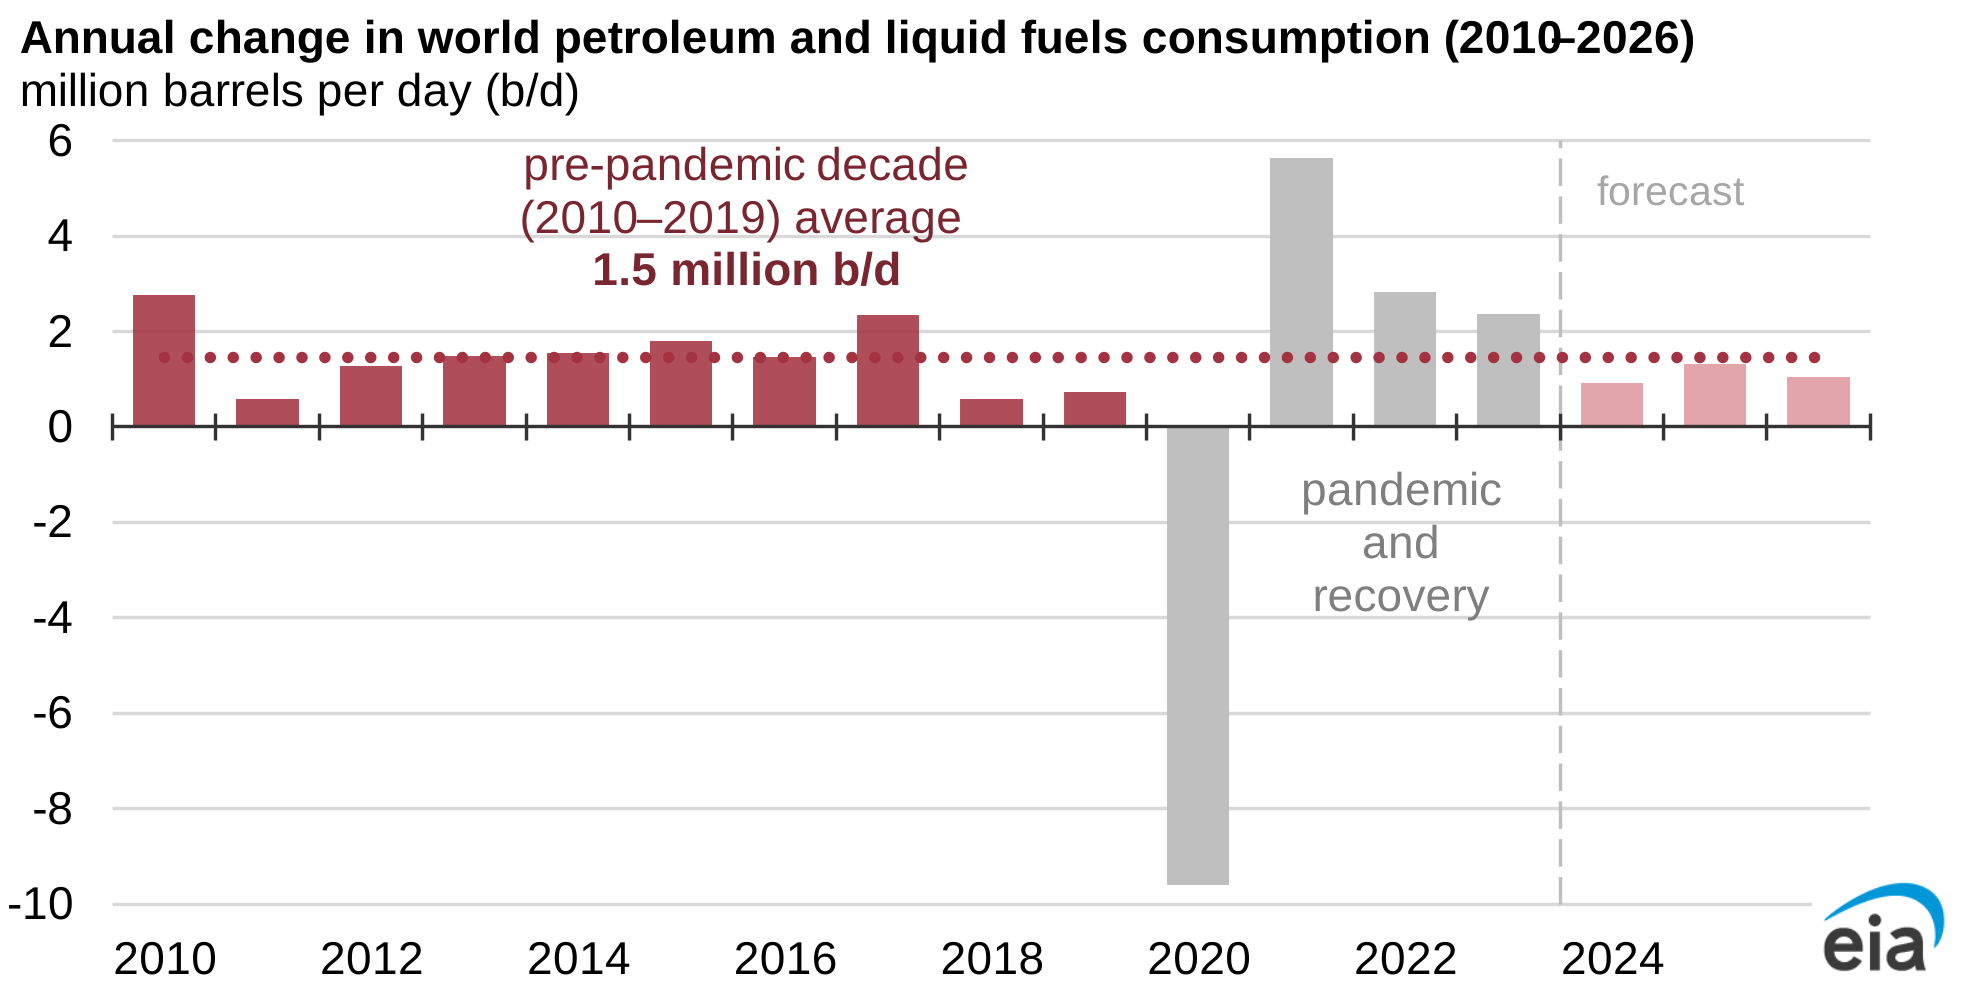
Global oil consumption growth in our forecast continues to be slightly less than the pre-pandemic trend. We expect global consumption of liquid fuels to increase by 1.3 million barrels per day (b/d) in 2025 and 1.1 million b/d in 2026, driven by consumption growth in non-OECD countries. Much of this growth is in Asia, where India is now the leading source of global oil demand growth in our forecast.
U.S. crude oil production growth begins to level off in 2026
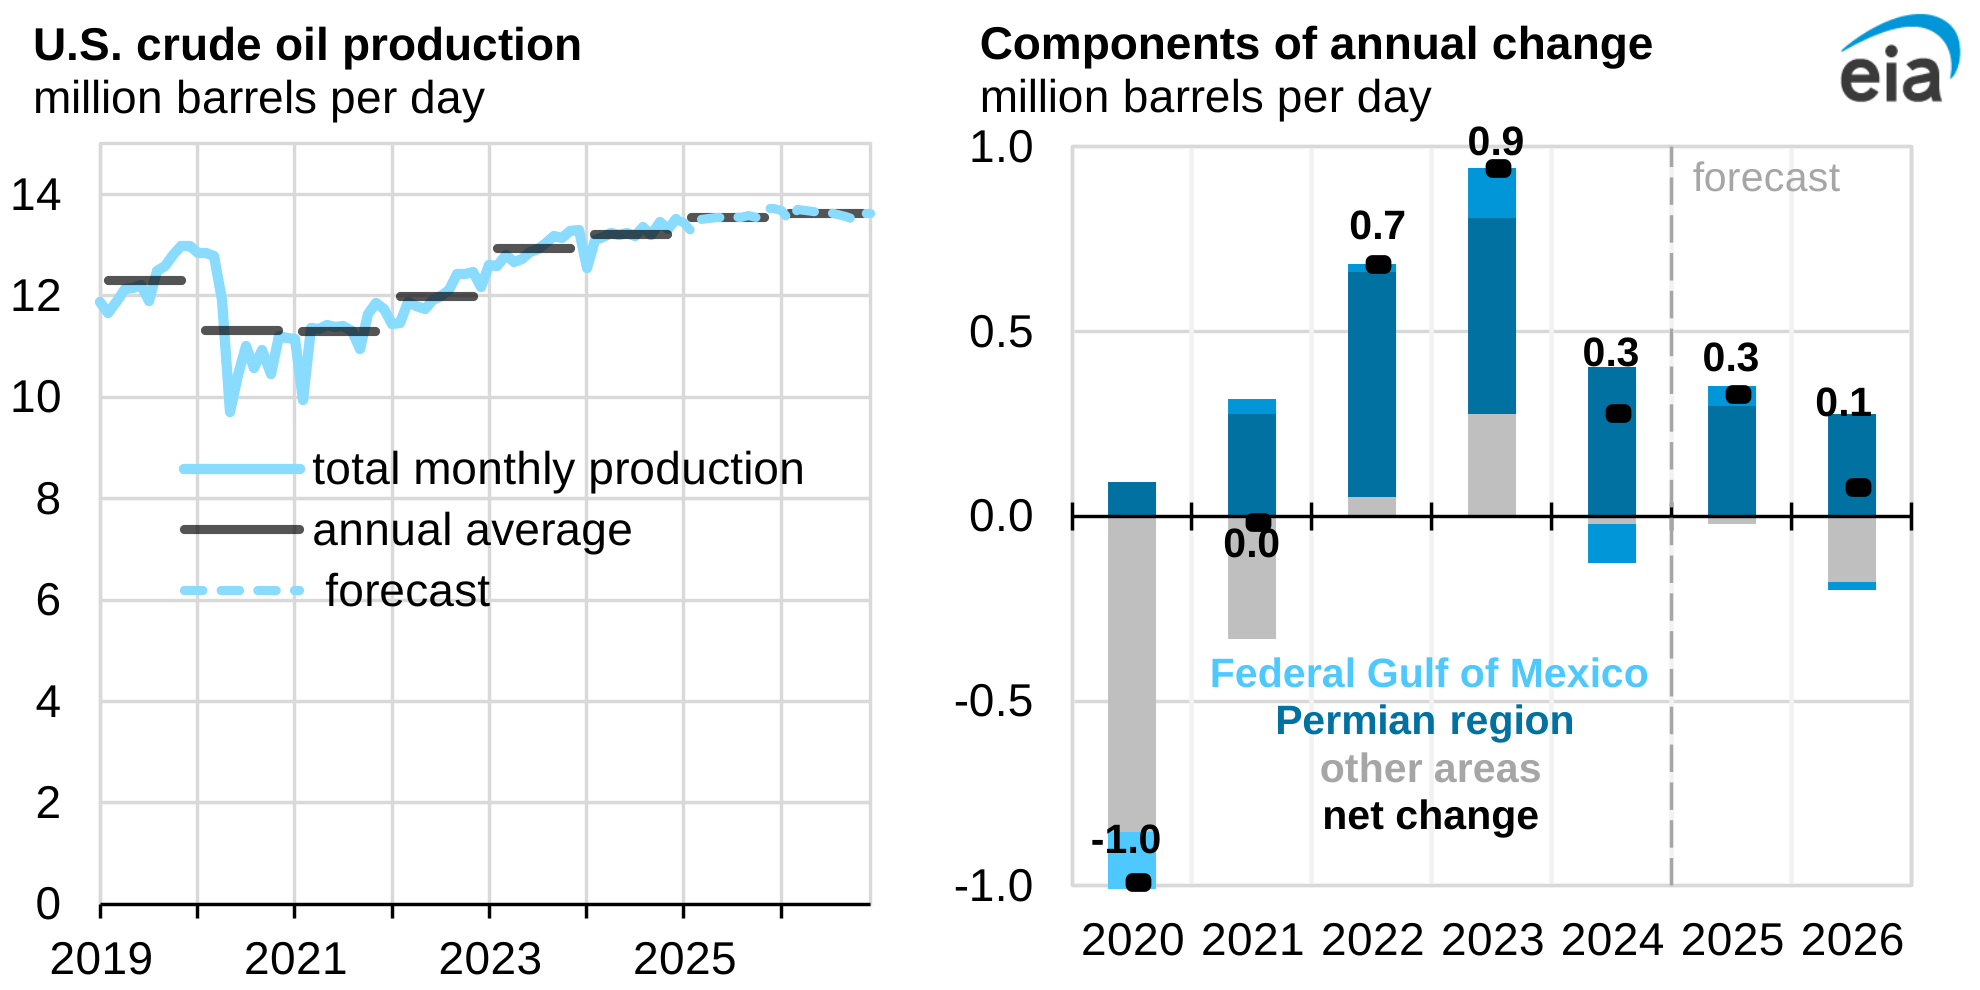
After reaching an annual record of 13.2 million b/d in 2024, U.S. crude oil production is forecast to average 13.5 million b/d this year. We expect crude oil production to be largely unchanged in 2026 as drilling and completion activity slows. The Permian region’s share of total U.S. production will continue to increase, accounting for more than 50% of all U.S. crude oil production in 2026. Despite this increased share, the expected production growth in the Permian in 2026 will largely be offset by production contraction in other regions.
The United States continues to export more liquefied natural gas (LNG)
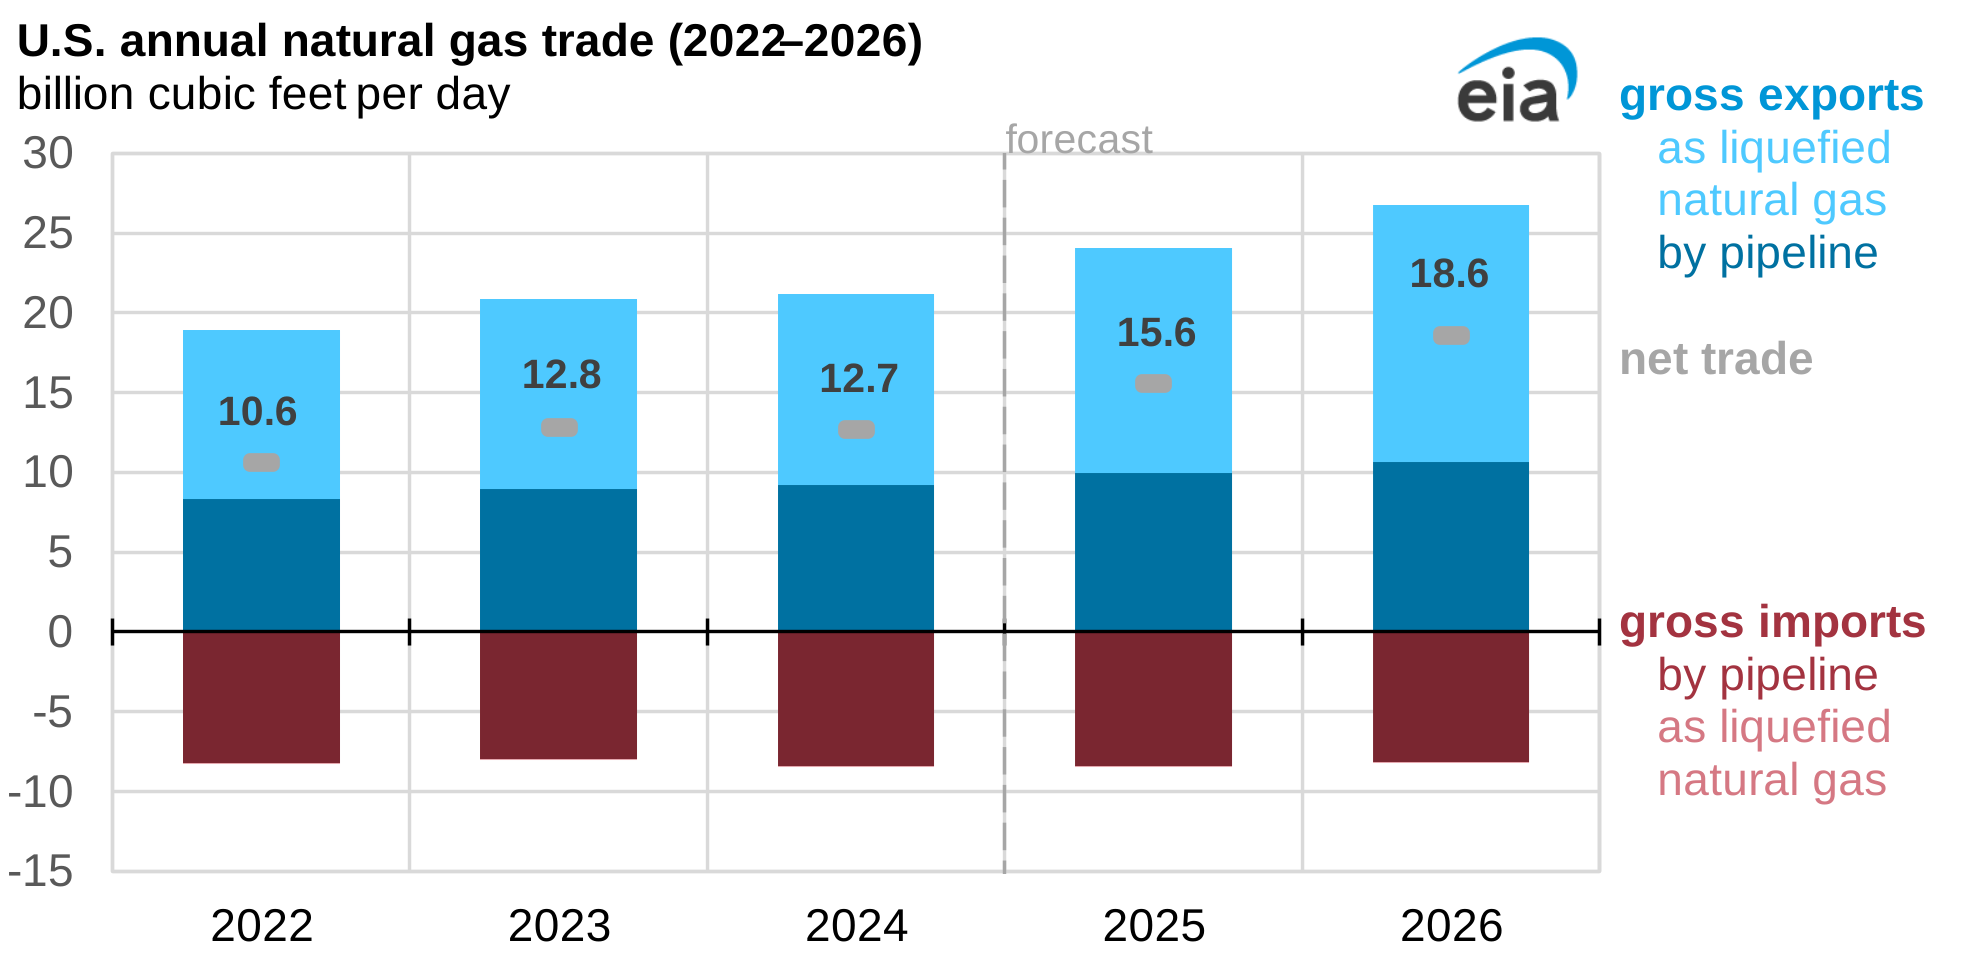
We expect exports of natural gas by pipeline and as LNG to increase in 2025, with most of the increase coming from LNG exports. Two new LNG export facilities—Plaquemines LNG and Corpus Christi LNG Stage 3—started producing LNG in December 2024, and Plaquemines LNG loaded and shipped its first LNG cargo on December 26.
Principal contributors: Tim Hess, Kristen Tsai