
Heat content of dry natural gas in Texas was among the lowest in the United States in 2023
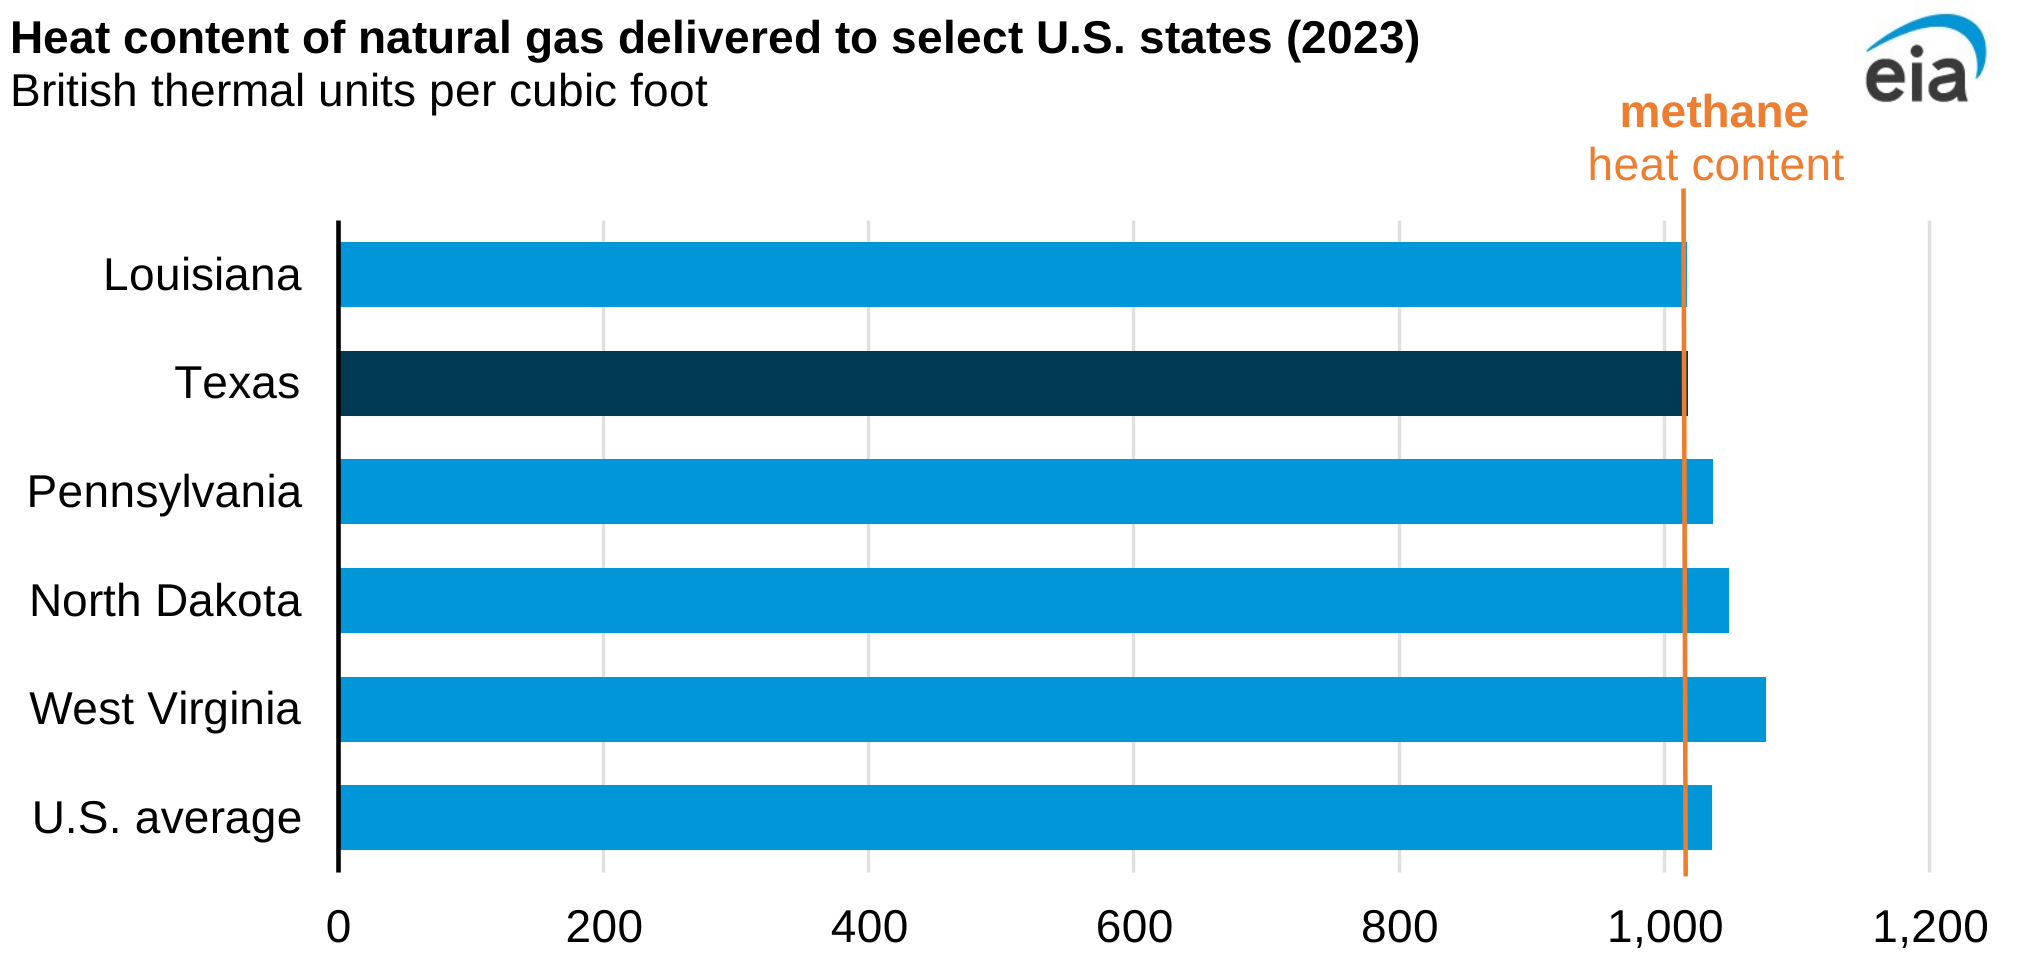
The heat content of dry natural gas delivered in Texas, which uses the largest volume of natural gas in the United States, was among the lowest nationwide in 2023, averaging 1,018 British thermal units per cubic foot (Btu/cf), or 1.7% below the national average (1,036 Btu/cf), according to our Natural Gas Monthly.
The heat content of natural gas is an indicator of its composition and quality and can vary greatly depending on the geology of the producing basin. Wet natural gas is composed primarily of methane, which has a heat content value of 1,010 Btu/cf, as well as other hydrocarbon gases, mainly ethane and propane. Ethane has a heat content of 1,770 Btu/cf, and propane has a heat content of 2,516 Btu/cf. When there is more ethane and propane, the average heat content of the natural gas stream is higher.
Processing plants in Texas use a cryogenic cooling process to recover natural gas liquids (NGLs) from the natural gas stream to make dry natural gas meet pipeline and consumer quality standards, including for heat content. In removing NGLs such as ethane and propane from the natural gas stream, the heat content of dry natural gas delivered to consumers in Texas was among the lowest nationwide in 2023 even though the NGL content of wet natural gas produced in the Permian Basin is among the highest nationwide.
Ethane made up 44% of the NGL removed from the natural gas stream in the Permian Basin in 2023, and propane represented an additional 30%, according to our Petroleum Supply Annual. In the United States, consumer natural gas-fueled appliances generally use natural gas with a heat content between 950 Btu/cf and 1,100 Btu/cf. Liquefied natural gas (LNG) export facilities—significant consumers of Texas natural gas—can install separators to reduce the heat content of the natural gas they receive when needed.
Operators in Texas also face pipeline takeaway capacity constraints for natural gas in the Permian. The recovery of more NGLs, particularly ethane, from the natural gas stream allows natural gas pipelines in the Permian to transport more methane. The recovered NGLs are transported on separate NGL pipeline networks and sold to the petrochemical sector, typically at higher prices compared with dry natural gas.
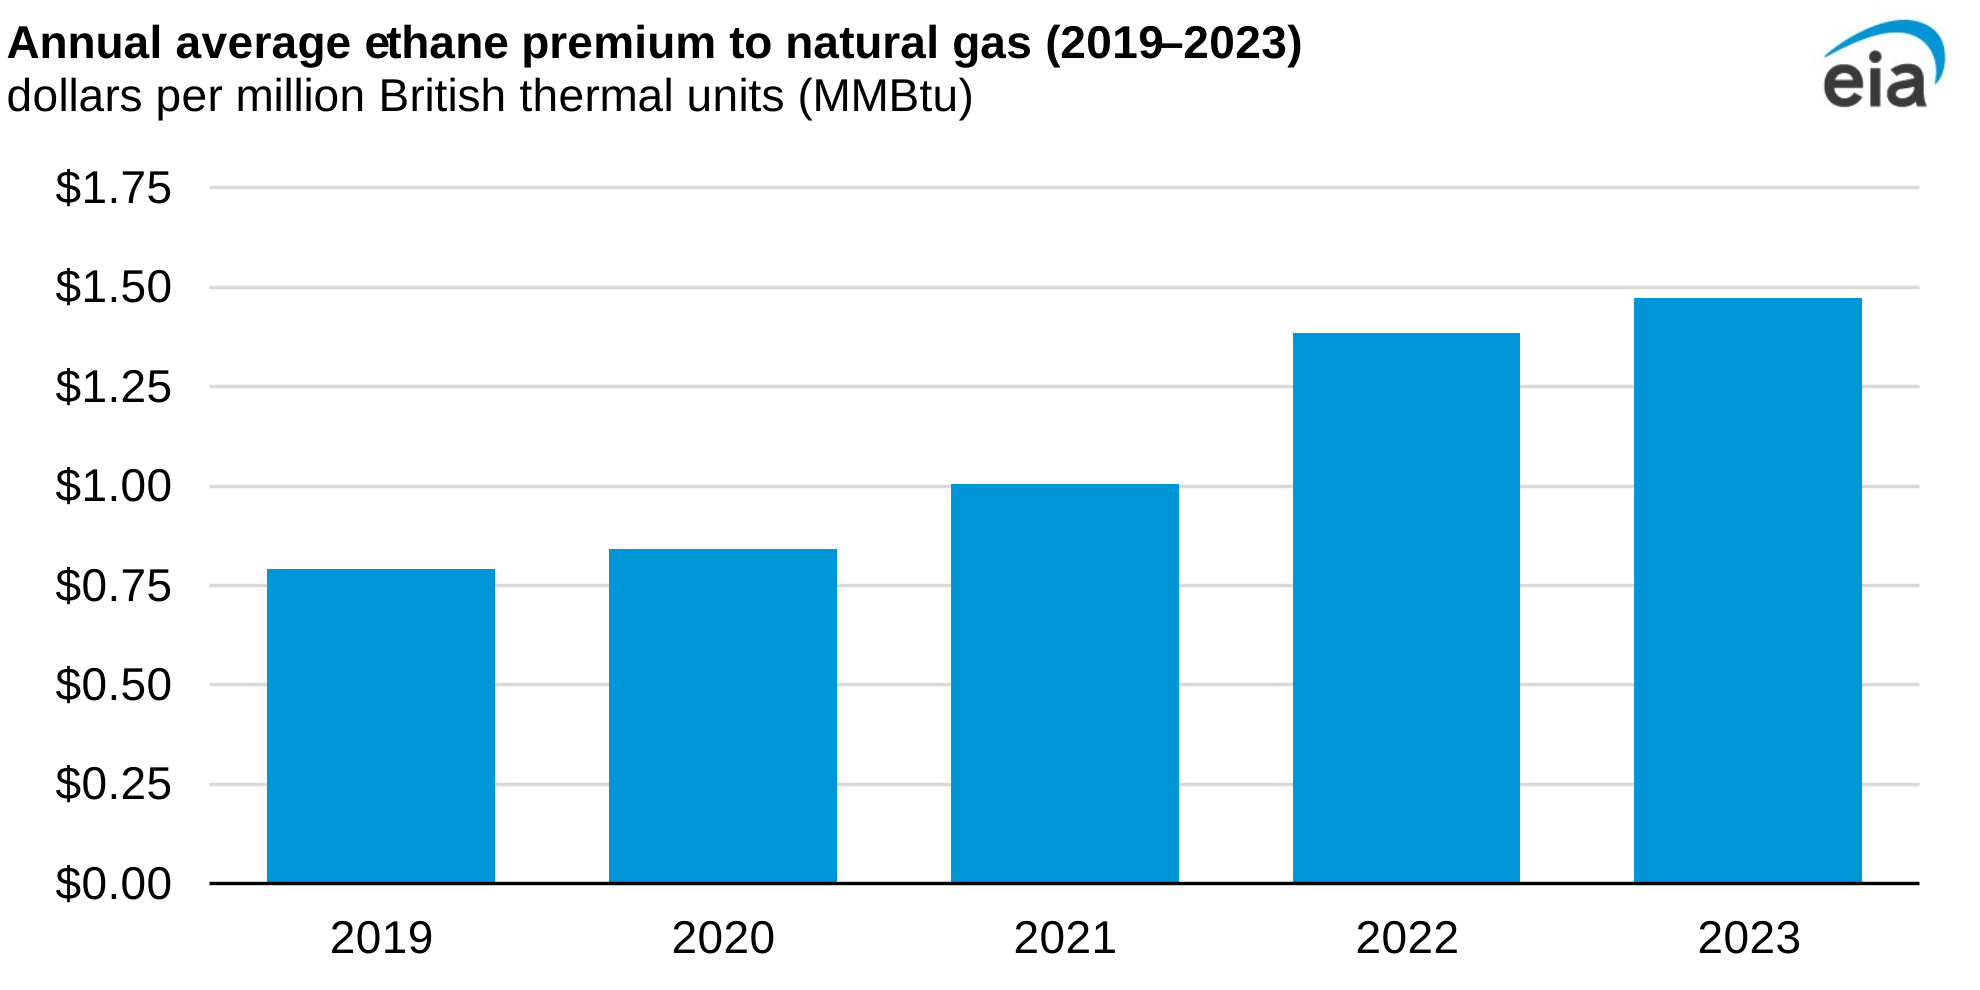
Notes: Ethane prices are based on the pricing hub in Mont Belvieu, Texas; natural gas prices are based on the Houston Ship Channel pricing hub. Annual average premium for 2021 is adjusted to exclude the four days of premiums during Winter Storm Uri, which reached as low as -$354.63/MMBtu.
Once the natural gas meets pipeline quality standards, natural gas plant operators can choose to recover additional ethane from the natural gas stream when prices create a favorable premium. The ethane premium to natural gas has increased in recent years in response to growing demand in domestic and international petrochemical markets. Excluding the severe impact of Winter Storm Uri on natural gas prices in early 2021, the annual average ethane premium in the United States has risen every year since 2019 from 79 cents per million British thermal units (MMBtu) to $1.47/MMBtu in 2023, according to data from Bloomberg and Natural Gas Intelligence. As more ethane has been recovered from natural gas flows because of the higher premium, the heat content of natural gas has fallen in recent years in several states including North Dakota, West Virginia, and Pennsylvania.
Principal contributors: Jordan Young, Trinity Manning-Pickett
Tags: natural gas, ethane, Texas, states