
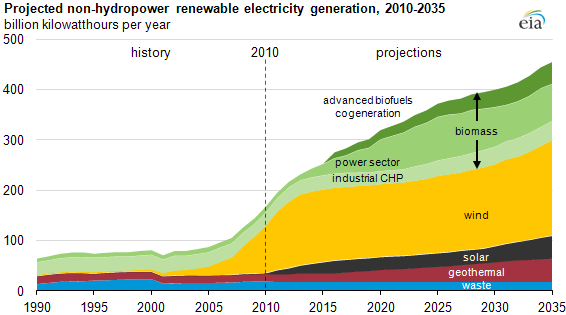
EIA projects U.S. non-hydro renewable power generation increases, led by wind and biomass
Download CSV Data
Wind and biomass dominate projected increases in U.S. renewable electricity generation, excluding hydropower, in EIA's Annual Energy Outlook 2012 (AEO2012) Early Release Reference case. Increased generation from non-hydro renewable energy resources in the electric power sector accounts for 33 percent of the overall growth in electricity generation from 2010 to 2035. The non-hydro renewable share of total generation in the projection increases from 4% in 2010 to 9% in 2035.
Biomass generation increases nearly 4-fold, driven by two main factors: Federal requirements to use more biomass-based transportation fuels (see Renewable Fuels Standard), which leads to increased electricity generation as a co-product from liquid fuel facilities such as cellulosic ethanol refineries. Also, co-firing of biomass with coal increases over the projection period, induced partially by State-level Renewable Portfolio Standards (RPS) as well as favorable economics in regions with significant forestry residues. Traditional Industrial combined-heat-and-power generation in sectors such as the pulp and paper industry continue to contribute to overall biomass generation.
The AEO2012 Reference case assumes implementation of current laws and regulations as specified, including the scheduled expiration of some tax credits at the end of 2012. Wind generation nearly doubles between 2010 and 2035, but the growth slows following the expiration of the production tax credit. The full Annual Energy Outlook, to be released in spring 2012, will analyze a number of sensitivities, including one assuming that incentives such as the production tax credit do not expire.
Solar grows rapidly, increasing nearly 7-fold by 2035, as near-term market growth is projected to result in lower system costs. The majority of the growth in solar is with photovoltaics, a significant portion of which comes from the end-use sector (i.e., rooftop solar). However, even with this strong growth, solar still accounts for a relatively small amount of total electricity generation in 2035. The projection reflects the expiration of the 30% solar investment tax credit in 2016, as provided by current law, continuing at 10% thereafter.
Growth in geothermal generation is projected to be robust relative to recent history for the industry, tripling over the projection period, but geothermal remains a small portion of overall generation. Geothermal resources suitable for centralized electricity production are concentrated in the west, and like other renewables, development is driven by State RPS policies.
A key downside uncertainty in the projections for non-hydro renewables is whether States will strictly enforce their RPS requirements, particularly if the current Federal tax credits that make RPS compliance less costly for consumers are not extended. Near-term growth in many renewable technology types is largely used to satisfy State-level RPS requirements. However, over the long term, renewable technologies may continue to be built as they become increasingly competitive with other electricity generation options.