
Natural gas pipeline capacity additions in 2011
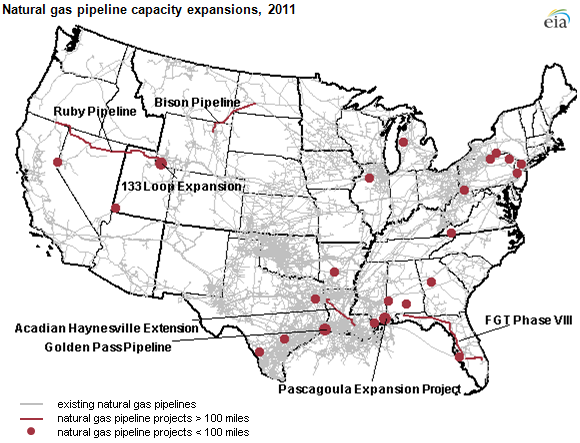
Notes: Capacity data only include interstate and intrastate transmission projects. Storage capacity additions and other infrastructure such as gathering and distribution lines are not included.
The U.S. Energy Information Administration estimates that U.S. natural gas pipeline companies added about 2,400 miles of new pipe to the grid as part of over 25 projects in 2011. New pipeline projects entered service in parts of the U.S. natural gas grid that can be congested: California, Florida, and parts of the Northeast (see map above). Only a portion of this capacity serves incremental natural gas use; most of these projects facilitate better linkages across the existing natural gas grid.
By convention, the industry expresses annual capacity additions as the sum of the capacities of all the projects completed in that year. By this measure, the industry added 13.7 billion cubic feet per day (Bcf/d) of new capacity to the grid in 2011. The six largest projects put into service in 2011 added 1,553 miles and about 8.2 Bcf/d of new capacity to the system. Much of this new capacity is for transporting natural gas between states rather than within states. Golden Pass, Ruby Pipeline, FGT Phase VIII, Pascagoula Expansion, and Bison Pipeline projects added 6.1 Bcf/d, or about 80%, of new state-to-state capacity.
Natural gas pipeline capacity additions in 2011 were well above the 10 Bcf/d levels typical from 2001-2006, roughly the same as additions in 2007 and 2010, but significantly below additions in 2008 and 2009 (see chart below). Capacity added in 2008 and 2009 reflected a mix of intrastate and interstate natural gas pipeline expansions, related mostly to shale production, liquefied natural gas (LNG) terminals, and storage facilities.
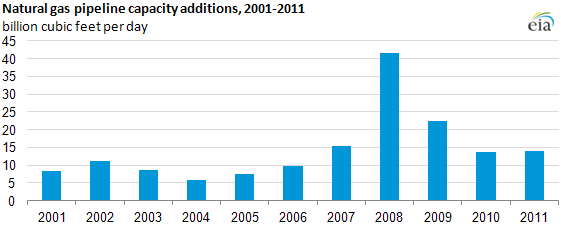
Notes: Capacity data only include interstate and intrastate transmission projects. Storage capacity additions and other infrastructure such as gathering and distribution lines are not included.
Tags: capacity, natural gas, pipelines, transportation