
U.S. energy intensity has dropped by half since 1983, varying greatly by state
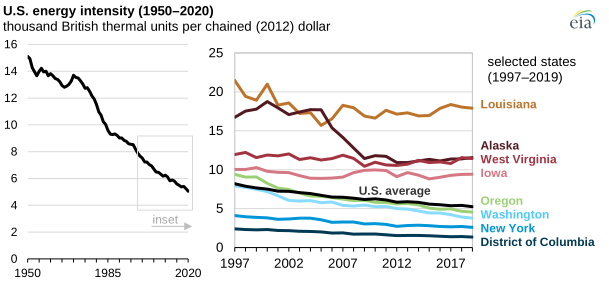
Energy intensity—calculated as total energy consumption divided by real gross domestic product (GDP)—is a common energy indicator and efficiency measure. In 2020, U.S. energy intensity reached a low of 5.05 thousand British thermal units (Btu) per chained 2012 dollar, down 4% from the previous year and less than half as energy intensive as the United States was in 1983. Energy intensity varies greatly by state, and some states operate with much greater energy intensity than the U.S. average.
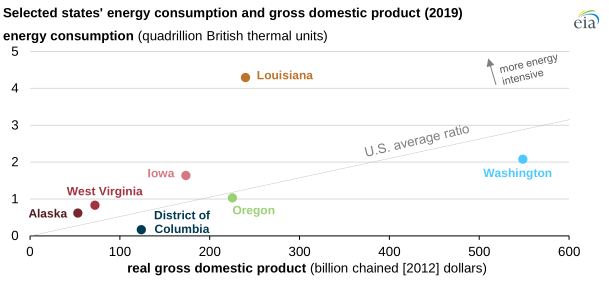
Louisiana, typically the state with the highest energy intensity, had the fourth-highest level of energy consumption of any state in 2019 and the 24th highest real GDP. States with high energy intensity, such as Louisiana, Wyoming, North Dakota, Alaska, and West Virginia, all have energy-intensive industrial sectors and are all top fossil fuel energy producers.
States with concentrated urban areas and relatively small industrial sectors tend to have lower energy intensities. The District of Columbia has a lower energy intensity than any state. Among states, New York has had the lowest energy intensity since 1997, the earliest year in our state-level data series.
From 1997 to 2019, the average energy intensity across the United States decreased by 36%. West Virginia and Iowa are notable exceptions to this trend. Since 1997, West Virginia’s energy intensity has decreased 4%, the smallest change in energy intensity in any state. Iowa’s energy intensity has decreased 6%, the second-smallest change.
Both West Virginia and Iowa rely on energy-intensive industrial activities for significant portions of their economies: coal, crude oil, and natural gas extraction in West Virginia and agriculture, food, and biofuel production in Iowa. In 2019, West Virginia was the 5th-most energy-intensive state and had the 35th-largest energy consumption and 10th-lowest GDP. Iowa, whose energy consumption and GDP are both about twice as large as West Virginia’s, was the 8th-most energy-intensive state.
Oregon is the only state that was more energy intensive than the U.S. average in 1997 but is now lower than the U.S. average. From 1997 to 2019, Oregon’s energy intensity decreased 51%. Only Washington’s energy intensity decreased at a faster rate (52%). Over the past two decades, Oregon and Washington transitioned their economies from energy-intensive activities, such as forestry and agriculture, to less energy-intensive activities, such as electronics and information technology.
Principal contributor: Mickey Francis