U.S. Energy Information Administration logo
Skip to sub-navigation
January 5, 2012

Current natural gas forward prices signal rising—but still low—prices in 2012
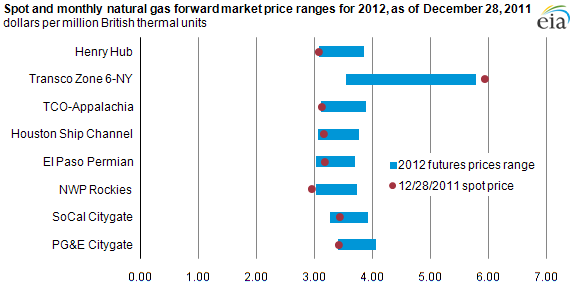
graph of Spot and monthly natural gas forward market price ranges for 2012, as of December 28, 2011, as described in the article text
Source: U.S. Energy Information Administration, based on Bloomberg.
Note: Forward prices are derived each month (January-December) by adding the locational basis swap to the NYMEX Henry Hub futures price for the given month at each location. The ranges reflect the minimum and maximum monthly price for months in 2012. For example, a January 2012 NYMEX Henry Hub futures contract valued at $3.50/MMBtu and a January 2012 Transco Zone 6-NY basis swap valued at $2.50/MMBtu would yield a $6.00/MMBtu price at Transco Zone-6 NY.

Natural gas forward market prices (as of December 28, 2011) signal a continuation of low natural gas prices into 2012. Winter 2011-2012 forward prices were recently the lowest in over ten years, and, of the eight trading points identified, only Transco Zone 6-NY (New York City) and PG&E Citygate (Northern California) show 2012 forward monthly price ranges that include prices above $4/MMBtu. Natural gas spot prices remained low throughout 2011 relative to prior years, reaching a two-year low in November. The spot natural gas price at Transco Zone 6 New York, shown in the graph, is above next year's average monthly trading ranges due to recent cold weather-driven demand. Current spot natural gas prices are lower than the 2012 forward contract range at several natural gas trading points identified in the chart.

The natural gas price at the Henry Hub in Louisiana informs much of the rest of the country, with prices largely following price movements at Henry. Similarly, forward prices, except for the Northeast (represented here by the Transco Zone 6-NY trading point), closely mirror 2012 forward prices at the Henry Hub. Northeast gas prices behave differently, with spot and forward prices higher during colder months due to expectations regarding pipeline constraints in transporting natural gas to the Northeast during times of high natural gas demand.
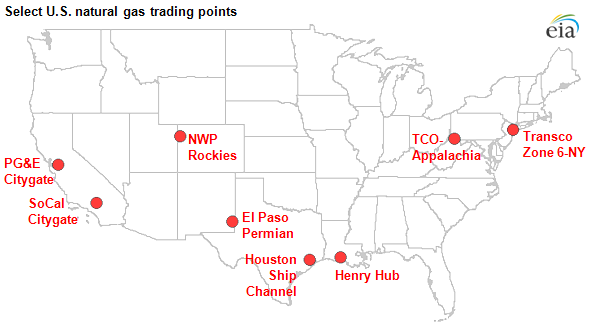
map of Select U.S. natural gas trading points, as described in the article text
Source: U.S. Energy Information Administration, based on Ventyx's Energy Velocity Suite.

Statistics
Analysis
Tools
Education
News

Petroleum & Other Liquids

Crude oil, gasoline, heating oil, diesel, propane, and other liquids including biofuels and natural gas liquids.

Natural Gas

Exploration and reserves, storage, imports and exports, production, prices, sales.

Electricity

Sales, revenue and prices, power plants, fuel use, stocks, generation, trade, demand & emissions.

Coal

Reserves, production, prices, employment and productivity, distribution, stocks, imports and exports.

Nuclear & Uranium

Uranium fuel, nuclear reactors, generation, spent fuel.

Renewable & Alternative Fuels

Includes hydropower, solar, wind, geothermal, biomass and ethanol.

EIA Survey Forms

Forms EIA uses to collect energy data including descriptions, links to survey instructions, and additional information.

Total Energy

Comprehensive data summaries, comparisons, analysis, and projections integrated across all energy sources.

U.S. States

State energy information, including overviews, rankings, data, and analyses.

International

International energy information, including overviews, rankings, data, and analyses.

Environment

Greenhouse gas data, voluntary reporting, electric power plant emissions.

Data Tools, Apps, & Maps

Tools to customize searches, view specific data sets, study detailed documentation, and access time-series data.

Open Data

EIA's free and open data available as API, Excel add-in, bulk files, and widgets

EIA Beta

Come test out some of the products still in development and let us know what you think!

Open Source Code

EIA's open source code, available on GitHub.

RSS Feeds

Subscribe to feeds for updates on EIA products including Today in Energy and What's New.