
EIA projects U.S. energy intensity to continue declining, but at a slower rate
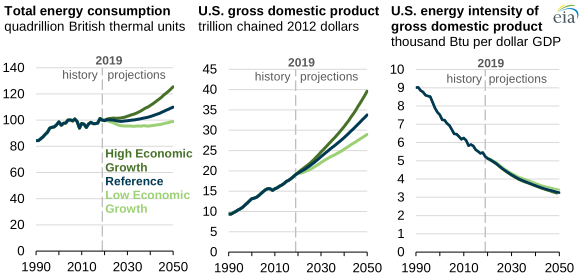
EIA’s recently released Annual Energy Outlook 2020 (AEO2020) projects that U.S. energy consumption will grow more slowly than gross domestic product (GDP) through 2050 as energy intensity continues its decades-long trend of decline through the AEO2020 forecast period. Energy intensity is a measure of how efficiently the economy uses energy to produce every dollar of GDP. In the AEO2020 Reference case, total U.S. energy consumption increases at an average annual rate of 0.3% between 2019 and 2050, and GDP grows at an annual rate of 1.9%, which indicates a 1.5% average annual decline in energy intensity during the projection period. By 2050, the domestic energy consumption associated with each dollar of U.S. economic growth is less than half of what it was in 2005.
Although growth of energy consumption in the United States is closely tied to growth in GDP and other economic assumptions, it is partially offset by improvements in energy efficiency and other changes in the economy that result in lower energy use per unit of economic output.
This trend does not differ much across the AEO2020 side cases that assume faster or slower rates of GDP growth. In the AEO2020 High Economic Growth case, both economic growth and energy consumption are higher than in the Reference case, but energy intensity still declines at 1.6% annually, close to the 1.5% annual decline in the Reference case. Similarly, in the Low Economic Growth case, energy intensity declines 1.4% annually.
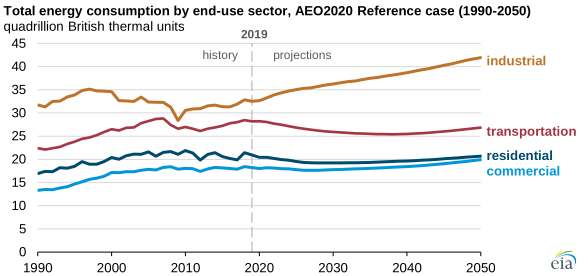
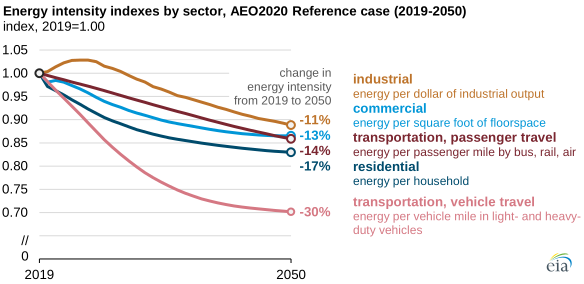
The U.S. industrial sector consumes more energy than any other sector, and its energy use grows faster than any other sector at an average annual rate of 0.8% through 2050 in the AEO2020 Reference case. Energy intensity in the U.S. industrial sector—measured as energy consumption per dollar of output—declines by 0.4% per year on average through 2050 in the Reference case, mainly because EIA expects less energy-intensive manufacturing industries to grow faster than more energy-intensive manufacturing industries.
Energy consumed in the U.S. transportation sector declines by an average of 0.2% annually between 2019 and 2050 in the Reference case. Current fuel efficiency regulations require no additional improvements for new light-duty vehicles after 2025 nor for new heavy-duty vehicles after 2027. Ultimately, vehicle travel demand outpaces fuel economy improvements, and on-road transportation sector energy consumption increases starting in 2041. Beyond light- and heavy-duty vehicles, the energy intensity associated with other transportation modes such as rail, bus, and air travel also decline as energy-efficient technologies and practices are adopted.
U.S. residential energy consumption growth is flat between 2019 and 2050, and commercial energy consumption growth averages 0.3% annually in the AEO2020 Reference case. Currently established efficiency standards and incentives lead to energy efficiency improvements. These improvements and growth in distributed electricity generation, including on-site solar, partially offset the effects of growth in the U.S. population, households, and commercial floorspace.
Principal contributor: Stacy MacIntyre