
Summer natural gas price spreads between Henry Hub and Appalachian region have narrowed
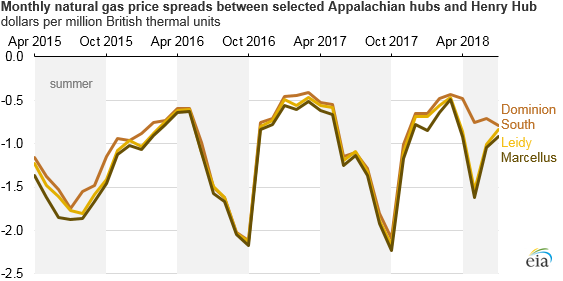
Over the past decade, natural gas production in the Appalachian region has grown faster than capacity to move the gas into U.S. markets, pushing down local prices. More recently, pipeline infrastructure from Appalachia has increased capacity to deliver Appalachian natural gas to regional markets, increasing relative spot prices at Appalachian hubs, and narrowing their price spreads relative to the U.S. natural gas price benchmark Henry Hub in Louisiana.
Natural gas production in the Appalachian region averaged 22 billion cubic feet per day (Bcf/d) in 2017, an increase of 25% from 2015 average levels. EIA’s latest data indicate that production has continued to increase, and production in the Appalachian region reached 26 Bcf/d in April 2018. Based on 2017 estimates, production in the Appalachian region accounted for almost half of total U.S. dry natural gas production.
The difference in price between Appalachian hubs and Henry Hub tends to follow a seasonal pattern. Generally, this price spread widens in the summer months (April through September) and narrows in the winter months (October through March), when demand in regions with more pipeline capacity increases in the winter months.
As infrastructure in the Appalachian region has increased, however, the summer price spread to Henry Hub has decreased. For example, in the summer of 2015, the Dominion South price was $1.48 per million British thermal units (MMBtu) lower than Henry Hub, but by summer 2017, the Dominion South Hub was $1.07/MMBtu lower than Henry Hub. Winter spreads at the Dominion South Hub, on the other hand, have remained relatively flat in recent years, averaging $0.90/MMBtu lower than Henry Hub.
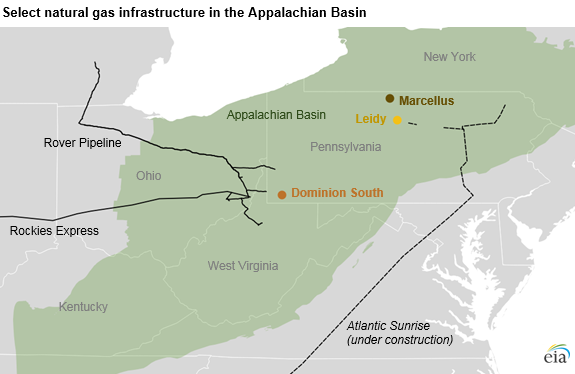
Other hubs in Appalachia have followed a similar seasonal pattern. Most of the recent pipeline buildout in Appalachia, including the Rover and Rockies Express pipelines, have been concentrated near the southwest border of Pennsylvania where the Dominion South hub is located. As a result, the price spread between Dominion South and Henry Hub has narrowed more than other hubs in north-central Pennsylvania, such as Leidy and Marcellus.
On June 1, 2018, Rover Pipeline’s interconnect to the Vector pipeline and Dawn Hub, near Detroit, Michigan, was completed, which increased takeaway capacity from southwest Pennsylvania and further narrowed the price spread between Dominion South and Henry Hub. In June, the Dominion South price was $0.71/MMBtu lower than Henry Hub; however, the Marcellus and Leidy hubs were $1.01/MMbtu and $1.04/MMbtu lower than Henry Hub, respectively.
The Transco Atlantic Sunrise project, which will connect natural gas production centers in northeastern Pennsylvania to demand centers in Mid-Atlantic and southern states, is expected to be completed by the end of 2018. As this project comes online, price spreads between the northern hubs and Henry Hub will likely narrow.
Principal contributor: Naser Ameen
Tags: natural gas, Pennsylvania, Henry Hub, map