
Maritime chokepoints critical to petroleum markets
Global Oil Chokepoints
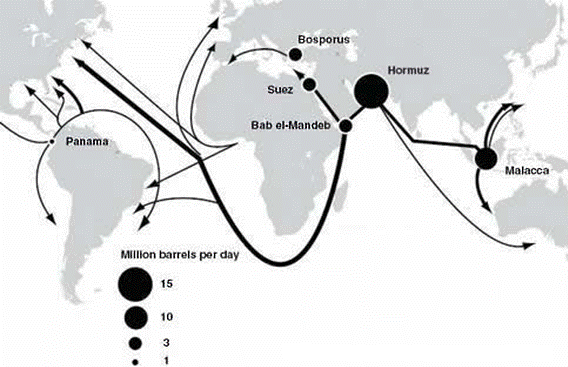
Maritime transit chokepoints are narrow channels along widely used global sea routes. Because about one half of the world's crude oil supply is moved by tankers on maritime shipping routes, world oil transit chokepoints are a critical part of global energy security.
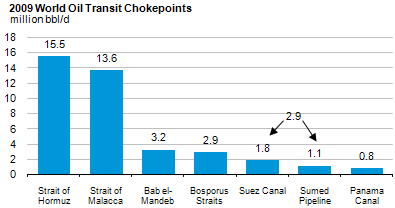
The international market is dependent upon reliable transport. The blockage of a chokepoint, even temporarily, can lead to a substantial disruption in energy markets.
Closure of some chokepoints would require the use of longer alternate routes, thereby increasing transportation costs, but for other chokepoints, there are limited alternate routes. As a result, there are existing, planned and proposed pipelines in many of these areas to bypass such chokepoints. EIA has compiled and analyzed data for seven major world oil transit chokepoints, summarized below:
- The Strait of Hormuz, connecting the Persian Gulf to the Arabian Sea, saw an oil flow of 15.5 million barrels per day (bbl/d) in 2009 when flows through this Strait accounted for roughly a third of all seaborne traded oil, or 17 percent of oil traded worldwide.
- The Strait of Malacca, located between Indonesia, Malaysia, and Singapore, links the Indian Ocean to the South China Sea and Pacific Ocean. Malacca is the shortest sea route between Persian Gulf suppliers and the Asian markets. It is the key chokepoint in Asia with an estimated 13.6 million bbl/d flow in 2009.
- The Suez Canal and SUMED Pipeline in Egypt are major routes for transit from the Persian Gulf to Mediterranean Countries and North America. Their closure would add an estimated 6,000 miles of travel around the continent of Africa. In 2009, total oil flows through the Suez were 1.8 million bbl/d, and SUMED flows were approximately 1.1 million bbl/d.
- The Strait of Bab el-Mandeb, links tankers originating in the Persian Gulf to the Suez Canal/SUMED pipeline and beyond. Its location, between the horn of Africa and Yemen, has made transit through this Strait vulnerable to piracy in recent years. An estimated 3.2 million bbl/d flowed through this waterway in 2009.
- The Bosporus Straits divide Asia from Europe, connecting the Black Sea with the Sea of Marmara. The 17-mile waterway supplies Mediterranean countries with oil from the Caspian Sea Region. In 2009, approximately 2.9 million bbl/d of oil flowed through these Straits.
- The Panama Canal, while an important route connecting the Pacific Ocean with the Caribbean Sea and Atlantic Ocean, plays a smaller role in world oil transit, mainly because of tanker size restrictions. In 2009, roughly 0.8 million bbl/d of oil, mostly refined products, traveled through the Canal.
Also, the Danish Straits are becoming an increasingly important route for Russian oil exports to Europe. In 2009, an estimated 3.3 million bbl/d of oil flowed westward through this waterway.
Tags: international, liquid fuels, crude oil, oil/petroleum, daily, chokepoints