
Markets indicate possible natural gas pipeline constraints in the Northeast this winter
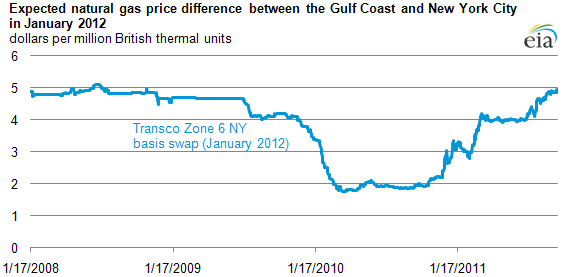
Note: A natural gas financial basis swap is a financial instrument that can be traded on exchanges or bilaterally between counterparties. The purpose of the instrument is to allow participants to trade the price differences between physical natural gas delivery locations. Natural gas financial basis swaps typically rely on two instruments: a NYMEX natural gas futures settlement price and the monthly index published price at a location. The NYMEX ClearPort Transco Zone 6 New York basis swap for January 2012 is an example.
Natural gas market participants watch indicators to determine where prices may be headed this winter. Current market indicators suggest that, because of possible pipeline constraints bringing natural gas to the Northeast Seaboard, the price in that region by January 2012 may be almost $5 per million British thermal units (MMbtu) above the price in the major producing region in the Gulf Coast. Their expectations of the spread between Northeast Seaboard and Gulf Coast prices have grown in recent months and now approach levels not seen since October 2008.
Given the uncertainties of winter demand, natural gas customers in the Northeast often want to guarantee winter prices ahead of time. Markets have evolved financial instruments that let them do so in two steps:
- Futures contracts guarantee a price in the producing region (at Henry Hub, Louisiana)
- Basis swaps guarantee the price of transportation from producing to consuming regions. For the Northeast, the most important basis swap is probably for delivery to New York (called Transco Zone 6 New York).
Putting these two instruments together guarantees the entire delivered price of gas for part or all of the winter.
Looking at New York basis swaps by themselves gives market participants a perspective on the value of transportation (rather than delivered natural gas) at a future date, or how much more they are willing to pay for gas in January 2012 in New York than in Louisiana. This difference reflects expectations about the likelihood of capacity constraints associated with moving natural gas on pipelines from one region to the other.
Taking January 2012 as an example, the chart shows that expectations of transportation costs to New York for the upcoming winter have changed considerably over the past three years. Beginning in 2008, market participants were willing to pay about $5/MMBtu to guarantee winter delivery in January 2012 in New York City. (During the first half of 2008, natural gas itself sold for $10–14/MMBtu.)
By 2010, market participants valued the transportation service to New York City for January 2012 from the Henry Hub at about one-half the 2008 levels. But last winter, it became clear that there could be severe constraints in delivering gas into the New York City area. That raised the price of natural gas along the East Coast to very high levels and made market participants rethink the value of transportation for 2012 as well. Throughout 2011, the price of January 2012 Transco Zone 6 NY basis swaps has continued to rise. They are now about the same level they were in 2008, although the underlying gas price is much lower.
Tags: financial markets, futures, natural gas, New York, prices, states