
EIA adds population density layers to U.S. Energy Mapping System
Note: Click to enlarge.
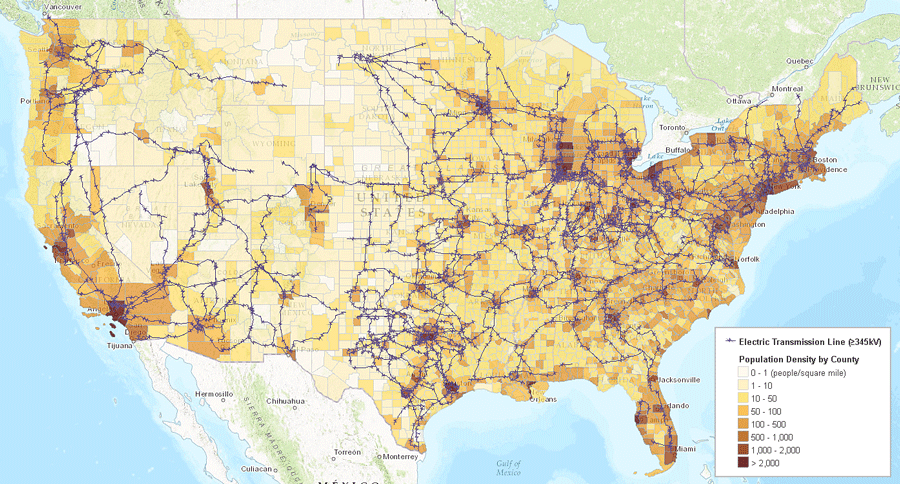
EIA’s U.S. Energy Mapping System and related interactive state maps now include two new layers showing population density to complement layers that already display energy infrastructure, energy resources, storm tracks, and flood hazard areas. The population density data will allow users to analyze how components of the U.S. energy system—such as electric power plants and transmission lines, crude oil and natural gas production sites, and other key components of the energy system—interact with and relate to centers of population.
The new layers are based on United States Census Bureau data from the 2010 Census:
- Population density by county for the United States and Puerto Rico (people per square mile)
- Population density by census tract for the United States and Puerto Rico (people per square mile)
Because the layer showing population density by census tract provides more detailed information, that layer may be more appropriate for analysis of small areas than the population by county layer. Census tracts are typically much smaller subdivisions of a county, with an average population of about 4,000 people and a general range of 1,200 to 8,000 people. Counties, on the other hand, have a much wider population range, with populations as high as 9.8 million people, for example, in Los Angeles County.
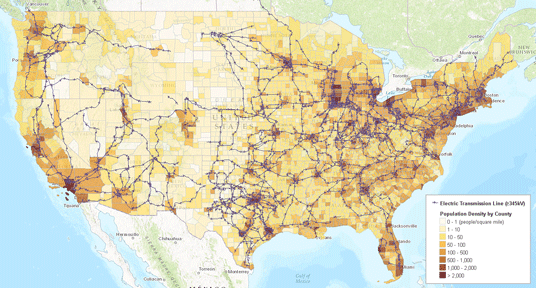
In the U.S. map above, high-voltage electricity transmission lines of 345 kilovolts (kV) or more overlay a thematic map where darker colors represent higher levels of population density by county. Adding this demographic information illustrates how the electric grid overlays areas of varying population density.
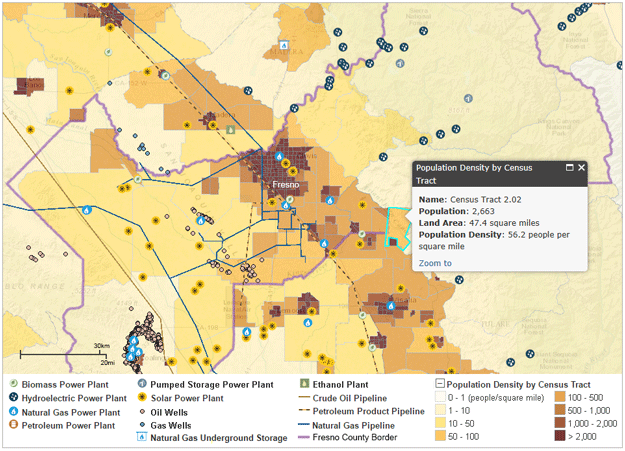
The map below, of the area around Fresno, California, combines population density by census tract with several energy infrastructure layers. The map shows energy infrastructure for the Fresno area distributed over a wide range of population densities. In the case of the Fresno area, some types of energy facilities (such as solar and natural gas-fired power plants) are found in both sparsely and highly populated areas, while others (such as hydroelectric power plants and oil and gas wells) are more prevalent in relatively sparsely populated areas. Users can click on a specific area of the map to see details about that census tract in an information pop-up box.
Principal contributor: Kip Platto
Tags: map