
First shipment of ethane from U.S. Gulf Coast arrives in Europe
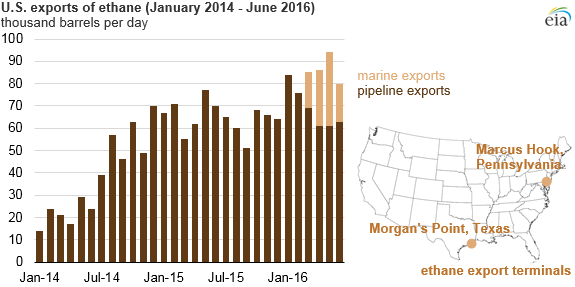
Increased production of ethane in the United States has led to increased ethane exports, first by pipeline to Canada and more recently by tanker to overseas destinations. Ethane is used domestically and internationally as a key feedstock for plastics production and other industrial uses.
The first U.S. ethane export terminal, located in Marcus Hook, Pennsylvania, about 20 miles southwest of Philadelphia, has an export capacity of 35,000 barrels per day (b/d) and began shipping ethane cargos in March 2016. The second U.S. ethane export terminal, opened by Enterprise Products Partners in Morgan's Point, Texas, recently sent its first shipment to Norway. This 200,000 b/d-capacity facility, located on the Houston Ship Channel, is the first ethane terminal in the Gulf Coast region.
Ethane is typically extracted from unprocessed natural gas, along with other natural gas plant liquids (NGPL). Unlike heavier natural gas plant liquids—such as propane, butanes, and natural gasoline—significant amounts of ethane can be left in natural gas transported on pipelines to natural gas customers, a practice known as ethane rejection. The relative tendency to either reject or recover ethane (i.e., leave it in the natural gas stream or separate it and market it) depends on ethane prices and demand and the ability of facilities to remove ethane from raw natural gas.
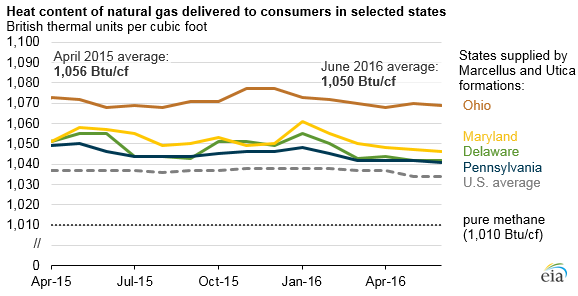
Because ethane has a higher heat content than methane—the primary component of natural gas—higher heat content of a natural gas stream often indicates that ethane is being rejected, or left in the natural gas sold to natural gas users. EIA has collected monthly data on natural gas heat content by state since 2013. The heat content of natural gas in states that receive shale gas produced from the Marcellus and Utica formations, such as Ohio, Maryland, Delaware, and Pennsylvania, has been consistently reported at or above national average levels. Ohio, in particular, receives a higher portion of its natural gas from the Marcellus and Utica formations. However, since early 2016, the natural gas heat content in these states has trended downward, indicating that producers have increasingly been extracting ethane. The lower heat content has coincided with the start of ethane exports out of Marcus Hook, which sources all of its ethane from the Marcellus and Utica formations.
From 2010 to 2015, the ethane share of total NGPL production dropped from 42% to 34%. Although other natural gas plant liquids have found ready markets close to key shale plays such as the Marcellus and Utica formations, the lack of pipelines and local markets for ethane in these areas has limited ethane recovery.
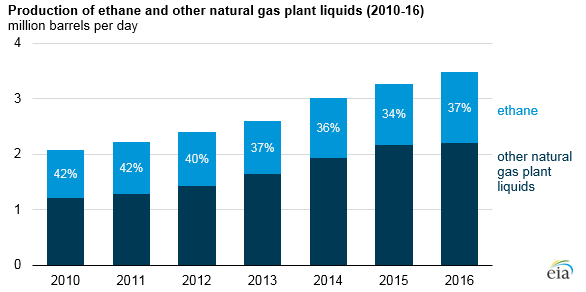
With more export capability and growth in domestic petrochemical demand, more ethane is expected to be recovered and brought to market. EIA's Short-Term Energy Outlook projects NGPL production to continue growing, from 3.6 million barrels per day (b/d) in May 2016 to 4.0 million b/d in December 2017. Nearly half of the projected total increase in NGPL production is ethane. Although an expectation of increasing oil prices and an associated increase in NGPL prices contributes to the outlook, a major driver of increased ethane production is growth in ethane demand, both within the United States and internationally.
Principal contributor: Warren Wilczewski