
U.S. gasoline prices this Thanksgiving are the lowest in seven years
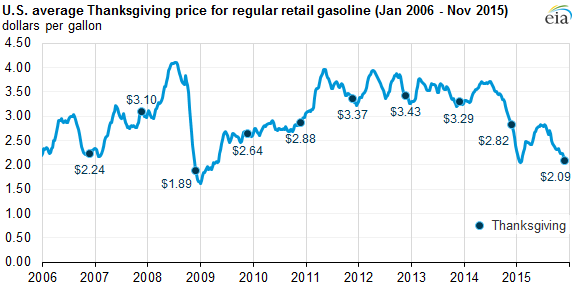
U.S. retail regular-grade gasoline prices continue to decline, averaging $2.09 per gallon (g) as of November 23, 73 cents lower than this time last year and the lowest heading into a Thanksgiving holiday weekend since 2008.
Traditionally, the Thanksgiving holiday is one of the heaviest travel times of the year in the United States, and much of that travel is by car. AAA estimates that during this Thanksgiving holiday period (November 25-29), 46.9 million people in the United States will travel more than 50 miles from home, with nearly 42 million people traveling by car. The estimated number of miles traveled is a slight increase compared with last year, and the estimated number of travelers is the highest for Thanksgiving since 2007.
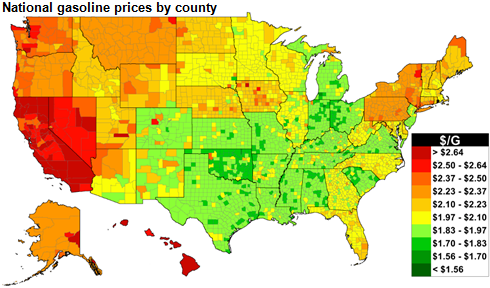
Gasoline prices across the country reflect differences in taxes, fuel specifications, and the characteristics of regional market supply and demand balances. In 2015, regional supply disruptions in California and in the Midwest resulted in higher wholesale and retail gasoline prices in the affected markets. Based on data for the selected major metropolitan areas surveyed in EIA's Gasoline and Diesel Fuel Update, retail gasoline prices as of November 23 range from a low of $1.83/g in Houston, Texas, to $2.79/g in Los Angeles, California.
Lower gasoline prices since 2014 are linked to lower crude oil prices. As global petroleum and other liquids production continued to outpace consumption in 2015, the resulting increases in global inventories of crude oil and petroleum products have put significant downward pressure on oil prices. The decline in crude oil prices also reflects concerns about lower economic growth in emerging markets, a negative factor for demand growth, and expectations of higher crude oil exports from Iran. Spot prices of North Sea Brent oil fell to $44.75 per barrel (b) in the second week of November, $34/b lower than the $79/b average during November 2014. Similarly, the U.S. average regular-grade gasoline price has fallen $0.82/g from the November 2014 average of $2.91/g.
EIA's November 2015 Short-Term Energy Outlook (STEO) projects the U.S. average retail price of regular gasoline will continue to decline for the remainder of the year and will average $2.06/g in December. The STEO forecast of annual average U.S. regular gasoline retail prices is $2.43/g in 2015 and $2.33/g in 2016, well below the $3.36/g price in 2014.
Principal contributor: EIA Staff
Tags: gasoline, map, prices, transportation