
Frigid weather reduces U.S. natural gas supply
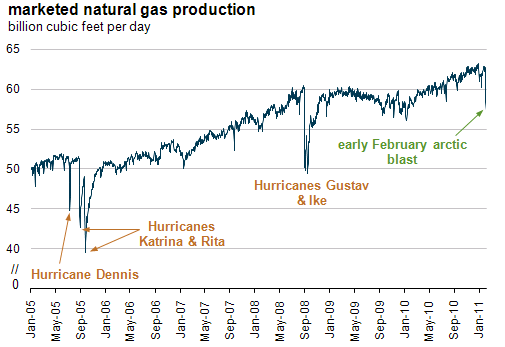
Source: BENTEK Energy, LLC data as of February 7, 2011.
Colder-than-normal weather during the first week in February led to the biggest non-hurricane natural gas supply disruption in the United States since at least 2005.
Due to a combination of well freeze-offs (gas flow blockages resulting from water vapor freezing in the gas stream) and other temperature-related well failures, processing plant shutdowns, electric power outages, and pipeline operational issues, estimated daily natural gas production fell from about 62 billion cubic feet per day (Bcfd) to less than 57 Bcfd, a decrease of 8%.
As shown in the chart, production shortfalls during the first week in February were large. The amount equaled about one-half of the losses (up to 10 Bcfd) associated with major Category 4 and 5 hurricanes in 2005 and 2008 and were double the levels associated with significant winter freeze-offs. Recovery from major hurricanes can range from days to months and sometimes wells never return to service. By contrast, about 3 Bcfd of gas production returned to service quickly after the recent freeze-offs.
Other market effects from the cold weather in early February were:
- Higher spot gas prices. Spot gas prices in West Texas topped $7 per million British thermal unit on February 3, or almost $3 higher than the spot price of gas at Henry Hub that day.
- Record winter gas use for power in Texas. According to BENTEK Energy, gas use for power generation set a single-day winter peak record on February 2 of 5.2 Bcfd. Gas use for power in Texas normally averages 3 Bcfd in the winter.
- Operational issues on pipelines. Multiple pipelines issued operational flow orders, imbalance warnings, and other emergency measures.
- Rolling blackouts in ERCOT. In response to the electricity supply shortage, ERCOT (the electric system operator for most of Texas) made public appeals for conservation, reduced the system voltage, and ultimately asked utilities to shed 4,000 MW, or about 8% of load.
Tags: natural gas, production/supply, weather