
Recent statistical revisions suggest higher historical coal consumption in China
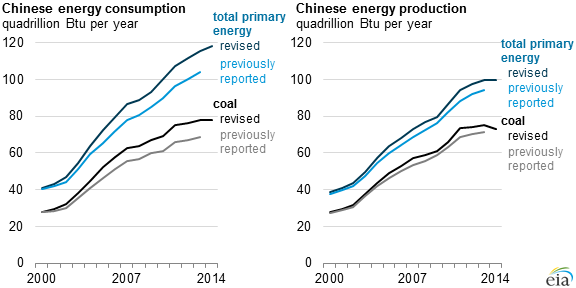
Note: Revised data from or implied by China Statistical Abstract 2015; previously reported data from China Statistical Yearbook 2014. The values for coal reflect its lower heating value.
New preliminary data from the China Statistical Abstract 2015 (CSA2015) show an upward revision to China's historical coal consumption and production. Energy-content-based coal consumption from 2000 to 2013 is up to 14% higher than previously reported, while coal production is up to 7% higher. These revisions also affect China's total primary energy consumption and production, which are also higher than previously reported—up to 11% and 7% in some years, respectively, mainly because of the revisions to coal. In 2014, energy-content-based coal consumption was essentially flat, and production declined by 2.6%.
China's National Bureau of Statistics (NBS) typically publishes the CSA in May. The CSA provides annual total primary energy consumption and production in tons of standard coal equivalent (tce), which reflects the energy content, but it does not provide the physical tonnage of coal consumption and production. Final and detailed statistics are published in the China Statistical Yearbook, which is typically released in September or October.
CSA2015 revises both the totals and the coal shares for all years since 2000 compared with what was provided in China Statistical Yearbook 2014, the most recent final statistics. In the absence of official revisions to physical tonnage of coal consumption and production, EIA independently assessed the historical average heat content of coal consumed and that of raw coal produced in China to estimate tonnages. The assessment factored in information from a variety of sources including information from NBS and other Chinese statistical agencies, industry reports, consultant survey results, expert interviews, and academic papers related to raw coal heat content and coal washing rates and yields by coal type. These estimates show the physical tonnage of coal consumption decreased by approximately 2% in 2014.
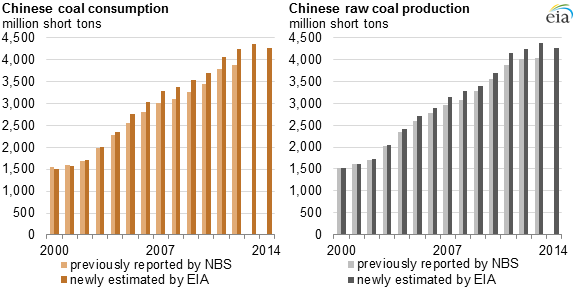
CSA2015 does not provide specific explanations for the extensive revisions to historical coal data. However, the direction and the magnitude of the revision are largely consistent with the widely reported issues associated with Chinese coal statistics, which likely are the reasons for previous upward revisions of coal consumption: disagreements between national totals and the sum of provincial reports, misalignment of reporting methods, and inherent difficulties in achieving data accuracy in a constantly and rapidly changing market as large as China's. Uncertainties remain in China's coal data, which should be recognized in future analysis.
Principal contributor: Ayaka Jones
Tags: China, coal, consumption/demand, production/supply